
Disclaimer: The opinions expressed by our writers are their own and do not represent the views of U.Today. The financial and market information provided on U.Today is intended for informational purposes only. U.Today is not liable for any financial losses incurred while trading cryptocurrencies. Conduct your own research by contacting financial experts before making any investment decisions. We believe that all content is accurate as of the date of publication, but certain offers mentioned may no longer be available.
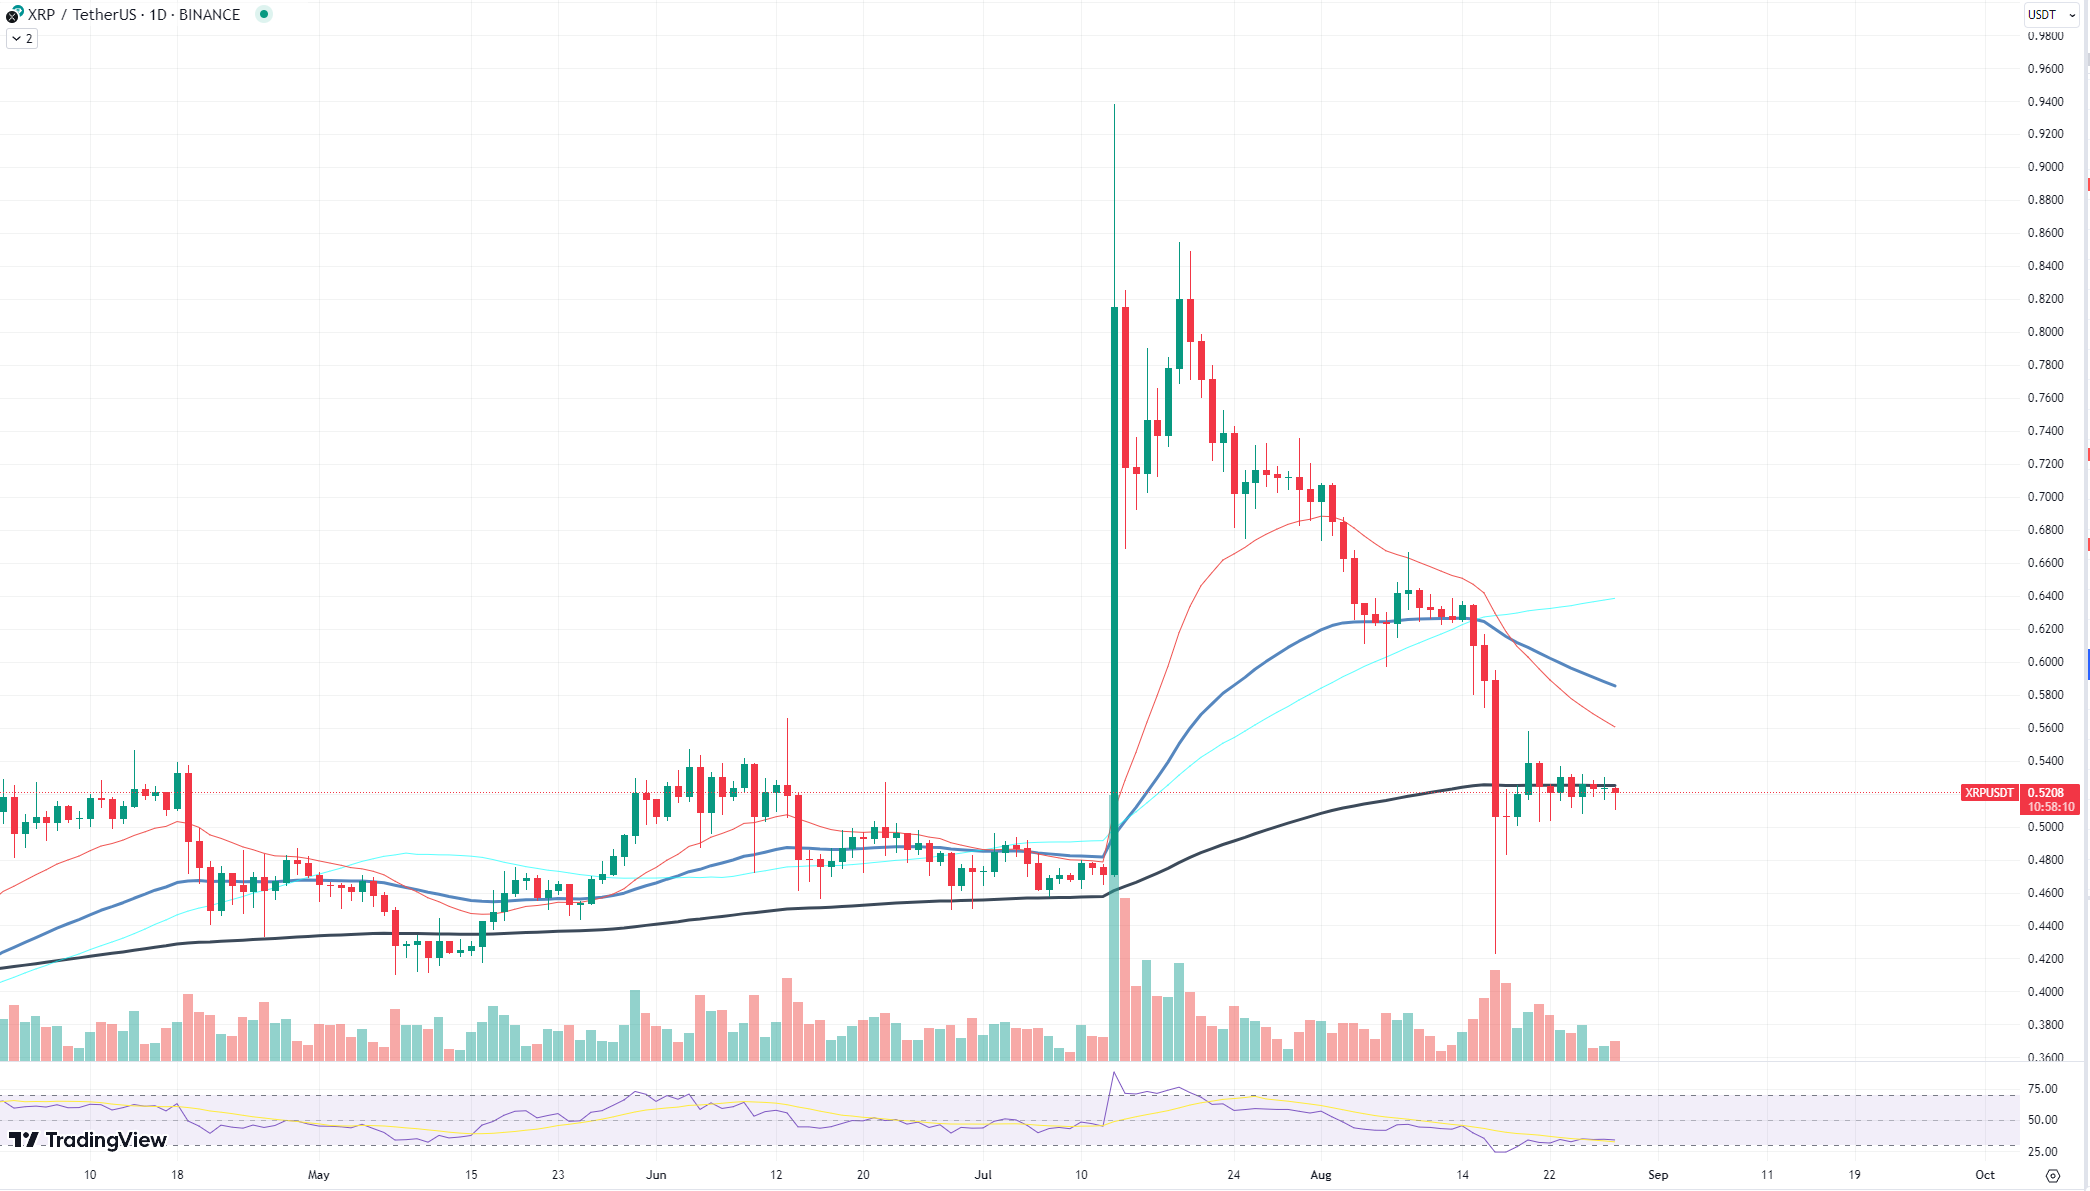
XRP is currently showing signs of extreme conditions, an extreme lack of volatility that is quite unusual for the asset. Over the past one to two weeks, XRP has been trading in a tight range, indicating that traders are either uncertain or uninterested in making significant moves.
Unfortunately, the lack of volatility is not the only concern. On-chain metrics for XRP are also at a low, with network activity seeing a massive drop. This is a red flag for any digital asset, as reduced network activity often signals a lack of user engagement and could potentially lead to decreased liquidity.
This trend is not just limited to XRP; the altcoin market, in general, seems to be losing traction. With Bitcoin also showing signs of consolidation, it appears that the broader market is in a state of flux. The low volatility and reduced network activity could be indicative of a larger trend affecting the entire crypto space.
Current conditions for XRP are extreme in the sense that they deviate from the asset's typical behavior. Usually known for its volatility and active community, the present calmness is unsettling for both traders and long-term holders. While some might argue that low volatility is good for an asset, in the crypto world, it often precedes significant price movements — either up or down.
Ethereum on verge of collapse?
Ethereum, the second-largest cryptocurrency by market cap, is currently facing a challenging market environment. The price has recently fallen below the critical $1,650 threshold and is now hovering around the local support level at $1,635. This downward movement is accompanied by a significant drop in trading volume, which is often a bearish indicator.
The situation becomes even more concerning when you consider the activity of large Ethereum holders, commonly known as "whales." These significant players have started moving their holdings, which could be a precursor to larger market shifts. Their actions often have a domino effect, influencing other traders and investors to follow suit.
If Ethereum's price falls below the $1,600 mark, it could pave the way for a further decline toward the $1,500 level. According to liquidity and market profiles, this is not just a doomsday scenario but a realistic possibility. The market seems to be preparing for this, and traders should be on high alert for any signs of continued downward momentum.
Adding to the bearish outlook is the looming threat of a "death cross," a technical indicator that occurs when a short-term moving average crosses below a long-term moving average. This is often interpreted as a bearish sign and could exacerbate the selling pressure on Ethereum.
LINK's questionable price performance
Chainlink (LINK), a decentralized oracle network, is currently in a precarious position as it has fallen below a critical price threshold. The asset's descending trading volume is a concerning indicator, suggesting that the market is losing interest or, worse, becoming increasingly bearish.
The Relative Strength Index (RSI), a momentum indicator, is currently moving sideways. In most cases, a sideways RSI is indicative of a trend continuation. Given that Chainlink is already in a downtrend, this could signal an extremely negative dynamic for the asset in the near term.

Adding fuel to the fire is the "death cross" that occurred 21 days ago. A death cross is a bearish signal that happens when a short-term moving average crosses below a long-term moving average. In Chainlink's case, this technical indicator could mean that the asset might not recover anytime soon and could even plummet further.
Given these factors, it is reasonable to assume that Chainlink could be headed for even lower price levels. The descending trading volume, sideways RSI and the recent death cross all point to a bearish outlook. Investors and traders should exercise caution and consider setting stop-loss orders to mitigate potential losses.
 Dan Burgin
 U.Today Editorial Team