Disclaimer: The opinions expressed by our writers are their own and do not represent the views of U.Today. The financial and market information provided on U.Today is intended for informational purposes only. U.Today is not liable for any financial losses incurred while trading cryptocurrencies. Conduct your own research by contacting financial experts before making any investment decisions. We believe that all content is accurate as of the date of publication, but certain offers mentioned may no longer be available.
XRP has painted a golden cross pattern on the four-hour intraday chart. This pattern, traditionally viewed as a bullish signal, is where the short-term moving average crosses above the long-term moving average. However, the real question is, does this pattern hold any practical value for investors, and does it provide any predictive strength?
Golden crosses often indicate a potential bullish shift in the market, suggesting an impending price rally. However, they are best understood in context and with consideration for other market factors. On the XRP intraday chart, this golden cross might seem promising, but it does not paint the whole picture.
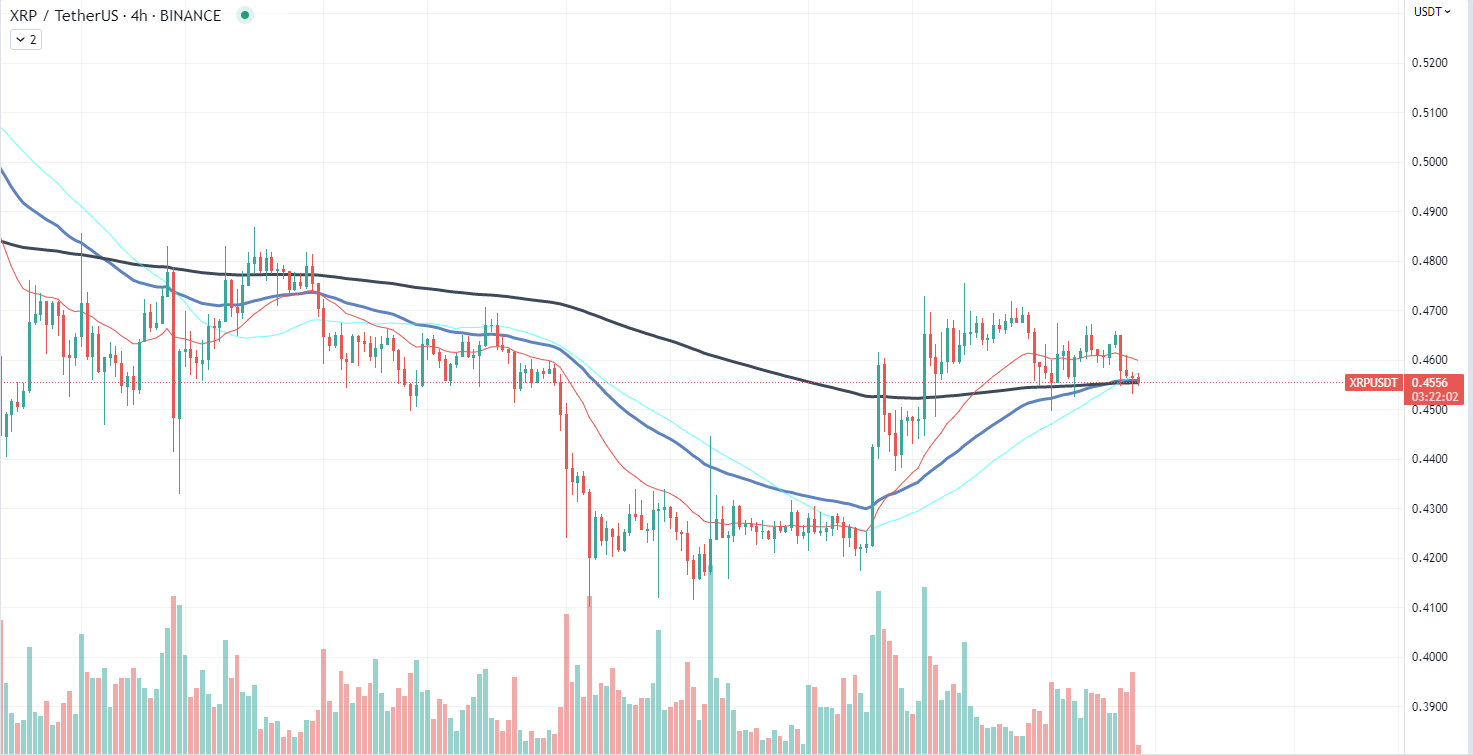
Looking at XRP's daily chart pattern, there are no similar bullish tendencies to be observed. In fact, in longer-term patterns, XRP appears to be moving sideways, a characteristic of a stable or uncertain market rather than a bullish one. While the golden cross on the intraday chart might signal a short-term bullish phase, the overall picture might not be as optimistic as one might hope.
It is also important to remember that while chart patterns like the golden cross can be useful indicators, they are not infallible predictors of future market movement. They are based on past data, and while they can often show trends, the volatile nature of cryptocurrency markets means that predictions based on these trends should always be approached with caution.
DXY on the run
The global cryptocurrency market stands at a critical juncture as the US Dollar Index (DXY) steadily makes its way back toward the 200 Day Exponential Moving Average (EMA). This milestone could become a reversal point for the index, and its implications for the digital asset market are significant.
In the context of traditional financial markets, the DXY is a measure of the value of the U.S. Dollar relative to a basket of foreign currencies. As the DXY nears the 200-day EMA, a widely used technical analysis indicator that averages the past 200 days of price data, investors are waiting with bated breath to see what happens next.
Two primary outcomes are possible. The first is a correction, where the DXY reverses its upward trend and starts declining. This scenario would likely stimulate a surge on high-risk markets, including the digital assets market. As the value of the U.S. dollar declines, investors might turn to cryptocurrencies as alternative stores of value, leading to a potential rally on the crypto market.
On the other hand, if the DXY breaks out and continues its upward climb, this could signify further strength in the U.S. Dollar. In this scenario, investors might flock to the safety of the USD, causing a sell-off in high-risk assets like cryptocurrencies, leading to a further decline in their prices.
Dogecoin in tough spot
Dogecoin (DOGE), the first meme coin, is enduring a tough period, having lost 32% of its value over the past three months. The asset's failure to find support for a rebound paints a grim picture for investors who were hoping for a bounce back.

The price of DOGE reached its local bottom recently, and despite the dip providing an opportunity for a potential price reversal, the asset has shown no signs of recovery. This inability to secure a foothold for a rebound further solidifies the downward trend the cryptocurrency has been locked into over the past quarter.
Adding to DOGE's woes is the bearish outlook suggested by the Relative Strength Index (RSI) indicator. The RSI is a momentum oscillator used by traders to identify overbought or oversold conditions. In the case of Dogecoin, the RSI indicates there is still ample room for further price corrections. This presents a warning sign for those anticipating an immediate turnaround.
 Dan Burgin
 U.Today Editorial Team