Disclaimer: The opinions expressed by our writers are their own and do not represent the views of U.Today. The financial and market information provided on U.Today is intended for informational purposes only. U.Today is not liable for any financial losses incurred while trading cryptocurrencies. Conduct your own research by contacting financial experts before making any investment decisions. We believe that all content is accurate as of the date of publication, but certain offers mentioned may no longer be available.
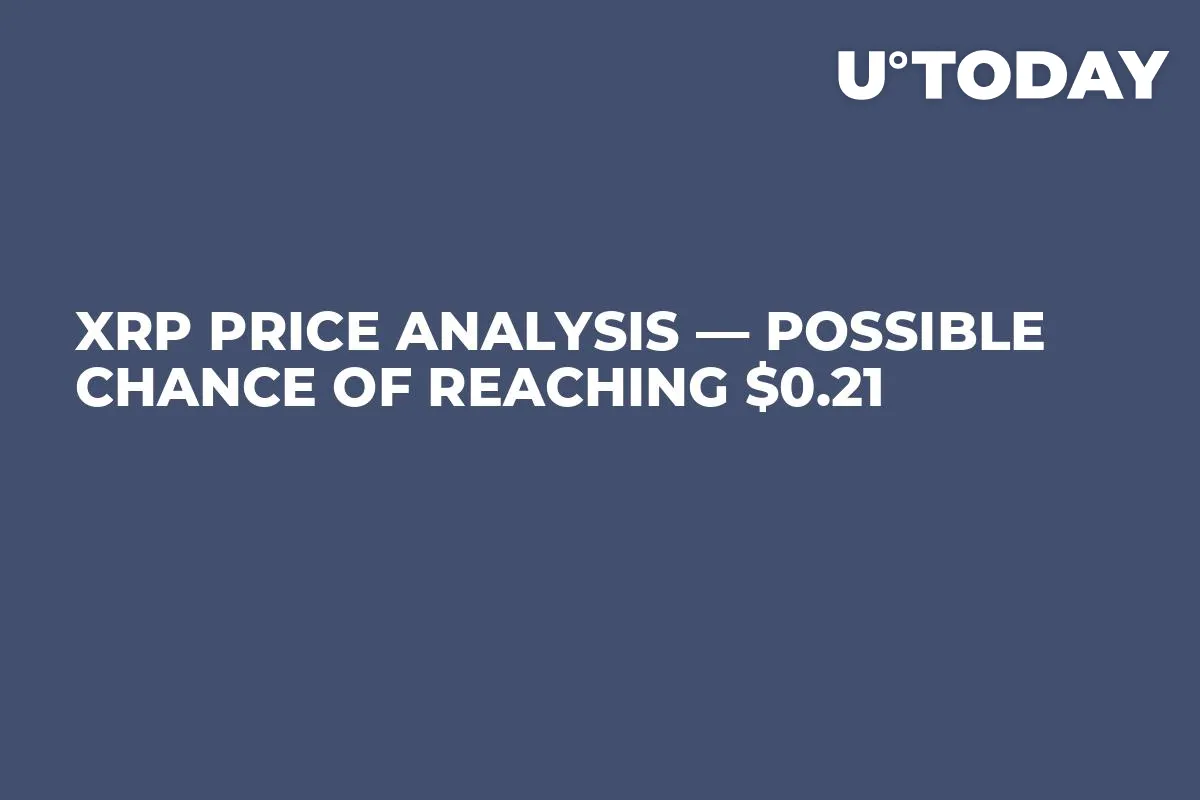
Most of the top 10 coins are slowly entering a correction phase after a continued sideways period. Only Bitcoin (BTC) and Bitcoin SV (BSV) are in the green zone, having risen 0.19% and 1.29% respectively.
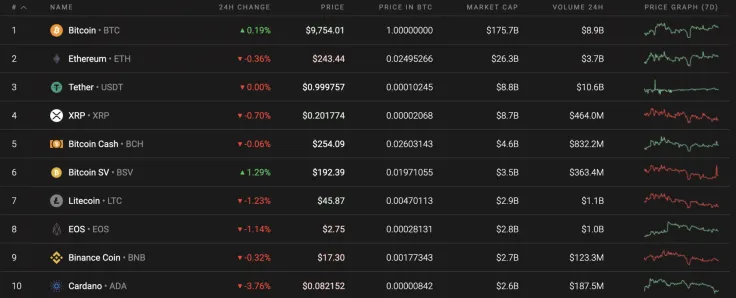
In terms of the weekly analysis of the XRP price, it has continued gradually falling. What is more, the decline is not just against the US Dollar but also in correlation with Bitcoin (BTC).
The relevant data for XRP is as follows.
-
Name: XRP
Advertisement -
Ticker: XRP
-
Market Cap: $8,918,508,186
-
Price: $0.202175
Advertisement -
Volume (24h): $1,058,269,655
-
Change (24h): -0.42%
The data is relevant at press time.
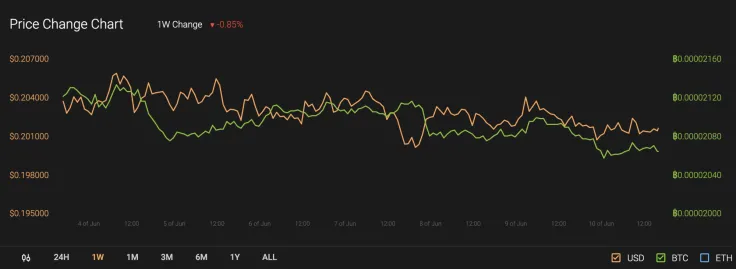
XRP/USD: Has the sideways trend shifted to a bearish one?
Yesterday morning, the price of XRP fell below the two-hour EMA55 level and tested the support of $0.20 late in the evening. This psychological level kept the pair from further decline and in the morning the pair consolidated in a rather narrow lateral range.
Today, growth may resume in the resistance area of $0.213. A break through this level would enable the price to gain a foothold at around $0.220.
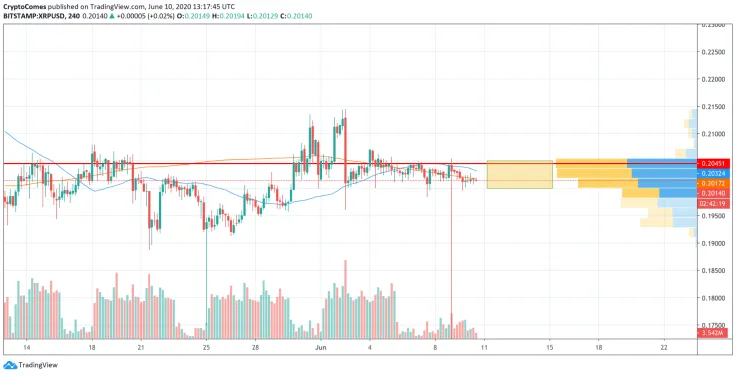
On the 4H chart, bearish sentiments are getting more powerful, although the trend has not yet changed. Due to high liquidity, there is buyer interest in the current zone. As neither bulls nor bears control the situation at the moment, the sideways movement is likely to continue over the next few days in the range of $0.20 - $0.2050.
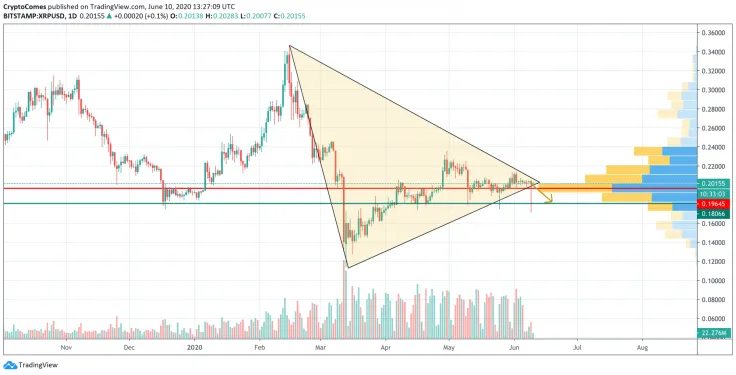
On the daily chart, XRP has formed a large Triangle pattern. This suggests that a downtrend will likely start soon. Also, the ongoing rise is not accompanied by increasing trading volume. If bears take the pattern down, the bearish trend will resume. In this case, the first stop will be a retest of support at $0.18.
XRP is trading at $0.2016 at press time.
 Dan Burgin