Disclaimer: The opinions expressed by our writers are their own and do not represent the views of U.Today. The financial and market information provided on U.Today is intended for informational purposes only. U.Today is not liable for any financial losses incurred while trading cryptocurrencies. Conduct your own research by contacting financial experts before making any investment decisions. We believe that all content is accurate as of the date of publication, but certain offers mentioned may no longer be available.
By the second part of Wednesday, all coins from the top 10 list have turned to red. If earlier altcoins showed better price dynamics than Bitcoin (BTC), today the situation is reversed. The rates of Bitcoin (BTC) and Ethereum (ETH) have diminished the least compared to most of the other assets.
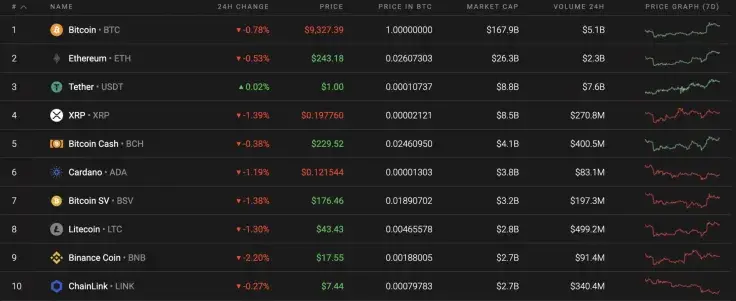
Take a look at key statistics for Bitcoin (BTC), Ethereum (ETH) and XRP:
|
Name
Strategy's Saylor Hints at Fresh Bitcoin Buy Amid Investor Ridicule
Shiba Inu Buyers Step In, Peter Brandt Reveals Bitcoin Price Rebound Target, Ripple Exec Confirms XRP as Priority — Top Weekly Crypto News
Morning Crypto Report: XRP in -77% Breakdown Danger, Massive 100,000 ETH Binance Dump by Satoshi-Era Bitcoin Whale, Cardano's Forgotten +25% February Wins
Leaked Email to Epstein Framed XRP Supporters as Enemy, Ex-Ripple CTO Says
|
Ticker Advertisement
|
Market Cap |
Price |
Volume (24h) Advertisement
|
Change (24h) |
|
Bitcoin |
BTC |
$172,318,813,903 |
$9,345.20 |
$15,820,615,419 |
-0.69% |
|
Ethereum |
ETH |
$27,257,150,676 |
$243.67 |
$6,188,528,751 |
-0.44% |
|
XRP |
XRP |
$8,870,743,176 |
$0.197954 |
$838,044,529 |
-1.30% |
BTC/USD
The current move could still be a false breakout to reset stop orders as Bitcoin (BTC) has not hit its July high of $9,470. There was no active movement after overcoming $9,360. In the price movements of the past week, one can find hints of more significant growth. For example, for the first time in a long time, the zone of buyer activity has not fallen but has shifted up—to the zone with the middle at $9,130.
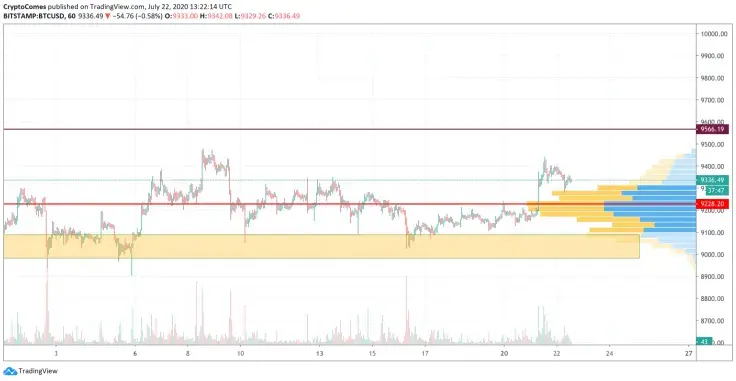
The upward shift of the support zone does not determine further growth. To confirm growth, it is necessary to at least overcome $9,560—the upper border of the previous accumulation zone. A typical accumulation zone shift of about $200 for this market, however, may be less—given the ever-decreasing volatility. This means that in the scenario with an increase, the support would be around $9,330.
Bitcoin is trading at $9,333 at press time.
ETH/USD
Yesterday buyers managed to gain a foothold above the side channel and test the resistance of $247 at the end of the day. The price retraced slightly overnight but has not yet reached the nearest support level, which is around $242.
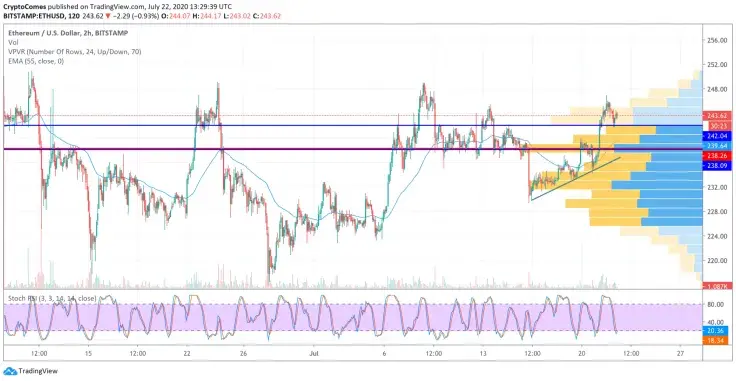
Most likely, the Ethereum (ETH) price will test the upper border of the blue range today. If it stops the rollback, then a recovery to the July high of $250 is possible soon.
If the bears push through the upper border of the side channel, then the pullback may reach the POC line ($238).
Ethereum is trading at $243.48 at press time.
XRP/USD
Yesterday, buyers were able to continue their recovery, but the growth dynamics were rather sluggish. XRP broke the psychological level of $0.20, but buyers did not have enough strength to continue growth toward the POC line ($0.203).
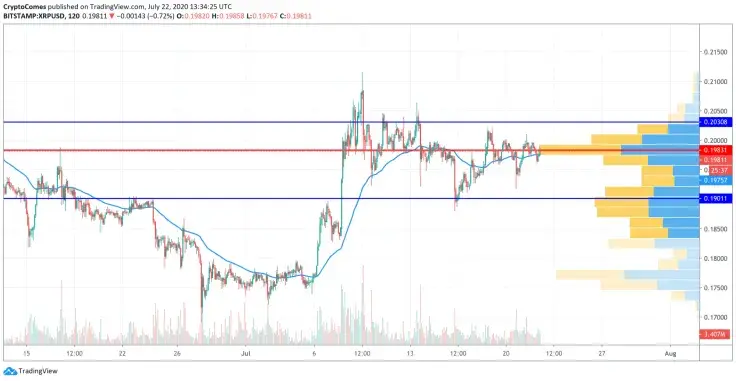
By this morning, the pair has settled in a narrow sideways range between the level of average prices and the resistance of $0.20. If bulls intensify the onslaught throughout the day, they will break the Point of Control indicator line ($0.203) and continue to rise to the resistance area of $0.213. In case bears strengthen the pressure and knock the pair out of the sideways range with support in the form of the 2H EMA55, then the decline will reach support at the level of $0.190.
XRP is trading at $0.1979 at press time.

 Alex Dovbnya
 Denys Serhiichuk
 Tomiwabold Olajide