Disclaimer: The opinions expressed by our writers are their own and do not represent the views of U.Today. The financial and market information provided on U.Today is intended for informational purposes only. U.Today is not liable for any financial losses incurred while trading cryptocurrencies. Conduct your own research by contacting financial experts before making any investment decisions. We believe that all content is accurate as of the date of publication, but certain offers mentioned may no longer be available.
The second half of Sunday is becoming more bearish as some of the coins from the Top 10 list are located in the green. Binance Coin (BNB) has been the top gainer as its rate has gone up by 4.72%.
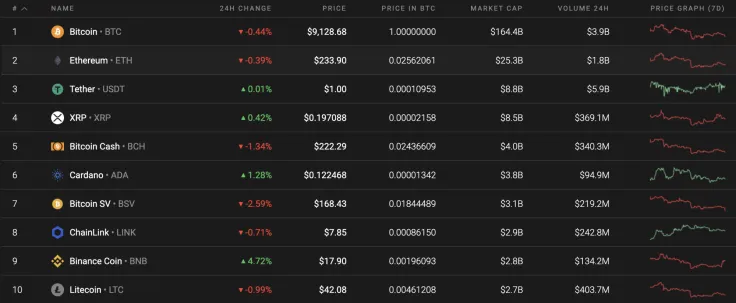
Below is the main data for Bitcoin (BTC), Ethereum (ETH), and XRP:
|
Name |
Ticker Advertisement
|
Market Cap |
Price |
Volume (24H) Advertisement
|
Change (24H) |
|
Bitcoin |
BTC |
$168,246,941,949 |
$9,125.64 |
$12,404,170,533 |
-0.47% |
|
Ethereum |
ETH |
$26,152,938,052 |
$233.88 |
$5,658,037,171 |
-0.52% |
|
XRP |
XRP |
$8,716,279,601 |
$0.196943 |
$928,105,261 |
0.02% |
BTC/USD
The moment of deep uncertainty has arrived. If you look at the daily time frame, you can see the formation of a 'triangle' pattern, the exit which possibly could occur in the near future.
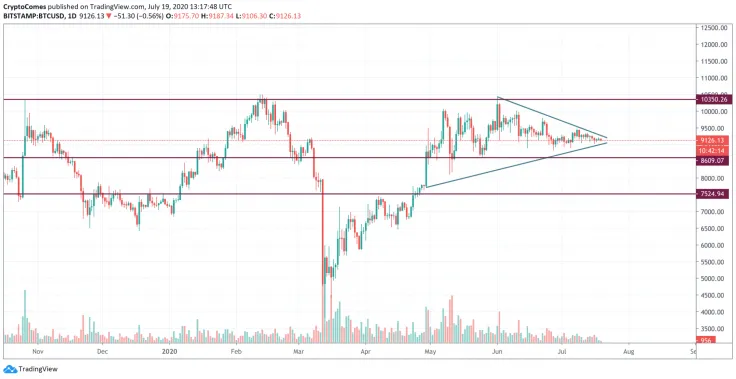
Markets are managed in such a way that they move from a narrow to a wide range. The pattern that follows this exit direction will determine future price dynamics for the next couple of months.

The seller's weak angle of attack is a positive factor that indicates an upward breakout. Therefore, the overall priority is bullish if Bitcoin (BTC) fixes above $9,800.
At press time, Bitcoin was trading at $9,125.
ETH/USD
Although the rate for Ethereum (ETH) has declined more than Bitcoin (BTC), it has more growth potential than the leading cryptocurrency. The price of the main altcoin has gone down by -2.46% in the last 7 days.
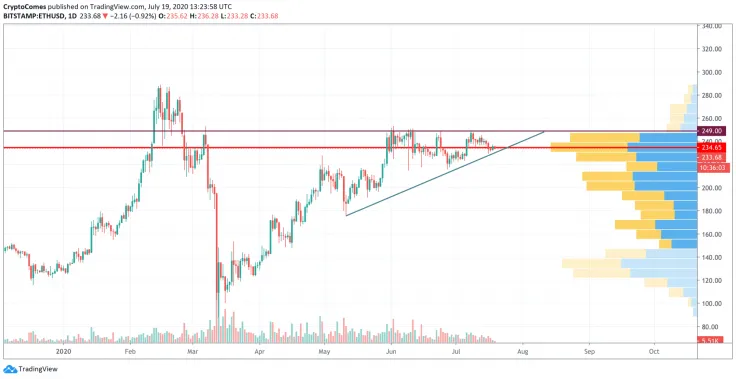
Ethereum (ETH) retested the bottom of the rising channel that formed in May. The trading volume is low; however, pressure from sellers is not as hard as before. Meanwhile, ETH's liquidity is high within the $230-$250 range. This is why the bulls may push the second most popular coin to the $250 mark by mid-August 2020.
At press time, Ethereum was trading at $233.92.
XRP/USD
XRP is the so-called top gainer today as it's the only coin from our list to be in the green. The rate for the altcoin has increased by 0.16%.
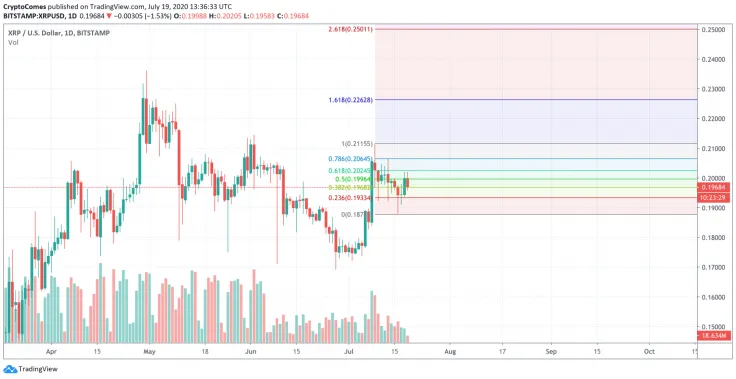
Looking at the daily time frame, XRP is showing effort to grow; however, the rise is unlikely to continue for a significant amount of time as it is not accompanied by the trading volume. Applying the Fibonacci retracement to the chart, there is a possibility that growth will continue until the coin reaches the 61.8% level ($0.2024). After that, XRP may face an ongoing drop if the trading volume remains at the same level.
At press time, XRP was trading at $0.1971.
 Dan Burgin
 U.Today Editorial Team