Disclaimer: The opinions expressed by our writers are their own and do not represent the views of U.Today. The financial and market information provided on U.Today is intended for informational purposes only. U.Today is not liable for any financial losses incurred while trading cryptocurrencies. Conduct your own research by contacting financial experts before making any investment decisions. We believe that all content is accurate as of the date of publication, but certain offers mentioned may no longer be available.
XRP might be hinting at a possible price reversal, as evidenced by a significant price indicator: the Relative Strength Index (RSI). At present, XRP's RSI stands at a value of 50, a pivotal point that could potentially signal a shift in price direction.
The Relative Strength Index is a momentum indicator used in technical analysis that measures the magnitude of recent price changes to evaluate overbought or oversold conditions. An RSI of 50 is often viewed as a critical juncture, as it can indicate potential turning points in price trends.
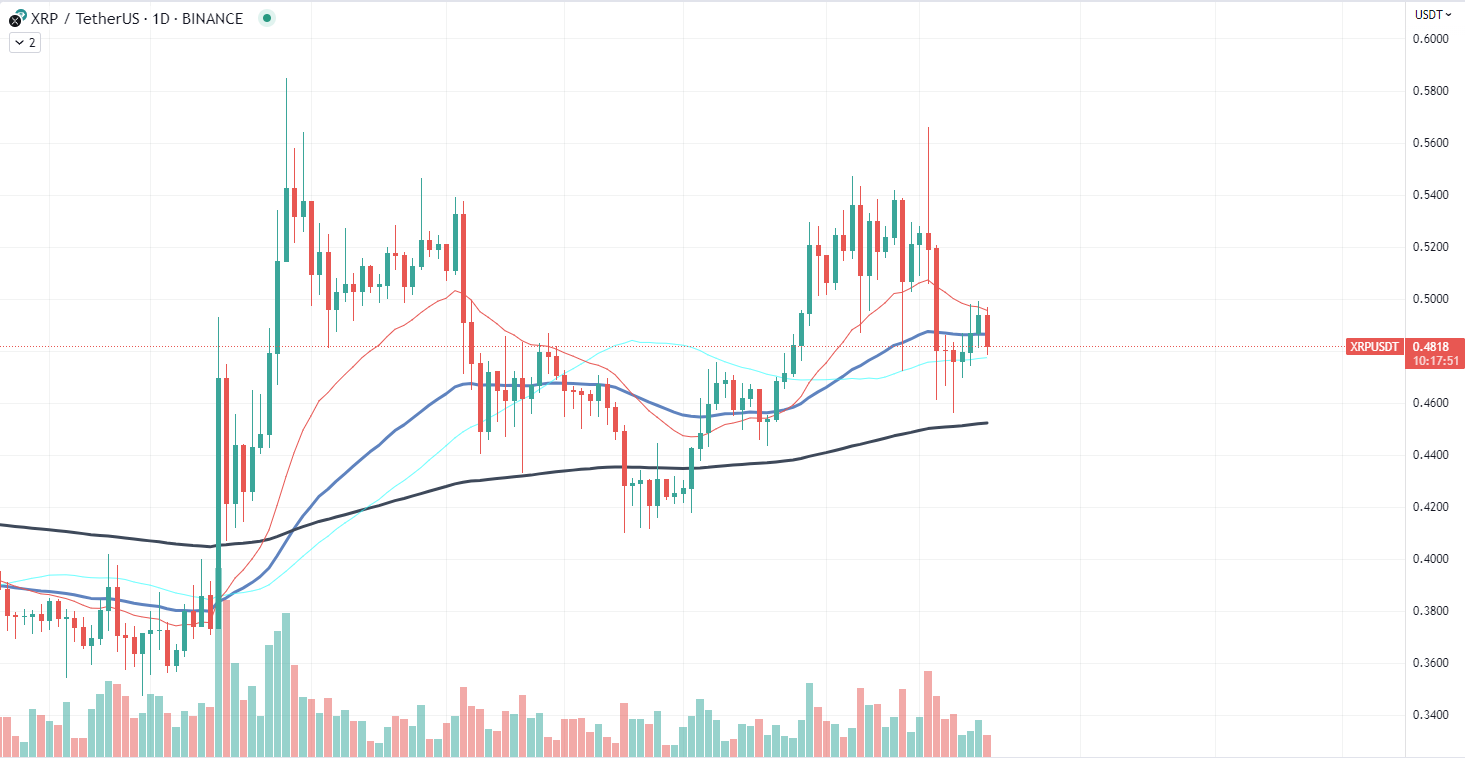
Beyond the RSI, other market indicators also signal a potential shift for XRP. Notably, XRP has been witnessing a surge in trading volume across multiple exchanges. This uptick in volume often points toward increased investor interest and could signify the beginning of an accumulation phase. In this phase, investors purchase the asset in anticipation of a future price increase, which could further fuel a price reversal for XRP.
However, there is a caveat. XRP's price is highly influenced by fundamental news surrounding Ripple, the company behind the cryptocurrency. Unfortunately, the recent news flow has been sparse, creating an air of uncertainty. This dearth of fundamental catalysts might keep some potential investors on the sidelines, making it harder for XRP to maintain upward momentum.
Arbitrum shows reversal potential
Arbitrum (ARB), the Layer 2 scaling solution for Ethereum, is showing promising signs of a resurgence, with rising network activity and increasing interest from notable projects and large-scale investors.
One of the key metrics indicating Arbitrum's potential resurgence is the increasing activity on its network. GMX, a leading decentralized perpetual trading platform, is contributing significantly to this uptick in network activity. The robust growth of projects like GMX on Arbitrum could act as a catalyst, attracting more projects to explore Arbitrum's Layer 2 solution.
The return of significant Arbitrum whales, or large-scale investors, to the network is another encouraging sign. These investors are often seen as trendsetters in the crypto community. Their renewed interest in Arbitrum could be interpreted as a strong vote of confidence in the platform's potential and might encourage smaller investors to follow suit.
From a price perspective, Arbitrum appears to be in an accumulation phase, a period characterized by investors increasing their holdings in anticipation of a future price increase. This belief is further supported by Arbitrum's relative strength index (RSI), a momentum indicator that measures the speed and change of price movements. Arbitrum's RSI is currently trading around the oversold zone, often considered a bullish signal by traders.
Furthermore, ARB, Arbitrum's native token, is hitting local lows. While this may seem discouraging at first glance, many savvy investors see such dips as buying opportunities, expecting the asset to rebound in the future.
Cardano under heavy pressure
Cardano (ADA) is currently in significantly oversold territory according to several key indicators. Most notably, the Relative Strength Index (RSI) for ADA has dropped to 24, a starkly low figure that typically indicates an oversold condition.
The RSI is a momentum oscillator that measures the speed and change of price movements. Generally, an RSI reading below 30 suggests that the asset is oversold and could be due for a price correction or rebound. With Cardano's RSI currently standing at 24, it is clear that the asset is experiencing severe selling pressure.
This downward pressure is reflected in ADA's recent price performance. In the past couple of weeks, Cardano has shed more than 31% of its value and is currently trading at approximately $0.25. This decline has understandably stirred concern among ADA investors, particularly given the steady price decline amid a broader cryptocurrency market correction.
Furthermore, trading volume for Cardano has also been on a steady decline, signaling a possible lack of buyer interest at current price levels. This trend of declining volume during downward price movement is often considered a bearish signal, adding to the concern surrounding ADA's immediate future.
Adding to the bearish outlook, the moving averages, a key trend indicator, are converging. When shorter-term moving averages cross below longer-term ones, it often indicates bearish sentiment on the market and can suggest further downward price movement.
 Dan Burgin
 U.Today Editorial Team