
Disclaimer: The opinions expressed by our writers are their own and do not represent the views of U.Today. The financial and market information provided on U.Today is intended for informational purposes only. U.Today is not liable for any financial losses incurred while trading cryptocurrencies. Conduct your own research by contacting financial experts before making any investment decisions. We believe that all content is accurate as of the date of publication, but certain offers mentioned may no longer be available.
Shiba Inu (SHIB), the meme cryptocurrency that has captured the hearts of the retail market, currently faces a critical juncture. The asset is eyeing a formidable resistance level, a threshold that has previously capped its price ascents. Recent price actions have seen SHIB nudging against this ceiling, sparking conversations about a potential breakout.
The resistance in question has been a significant point on the charts, one that SHIB has flirted with but has consistently failed to conquer convincingly. Observing the recent candlestick formations, there is palpable tension between bulls pushing up and bears holding the line. A decisive closure above this level could signal a shift in market dynamics, leading to a possible breakout and subsequent bullish rally.
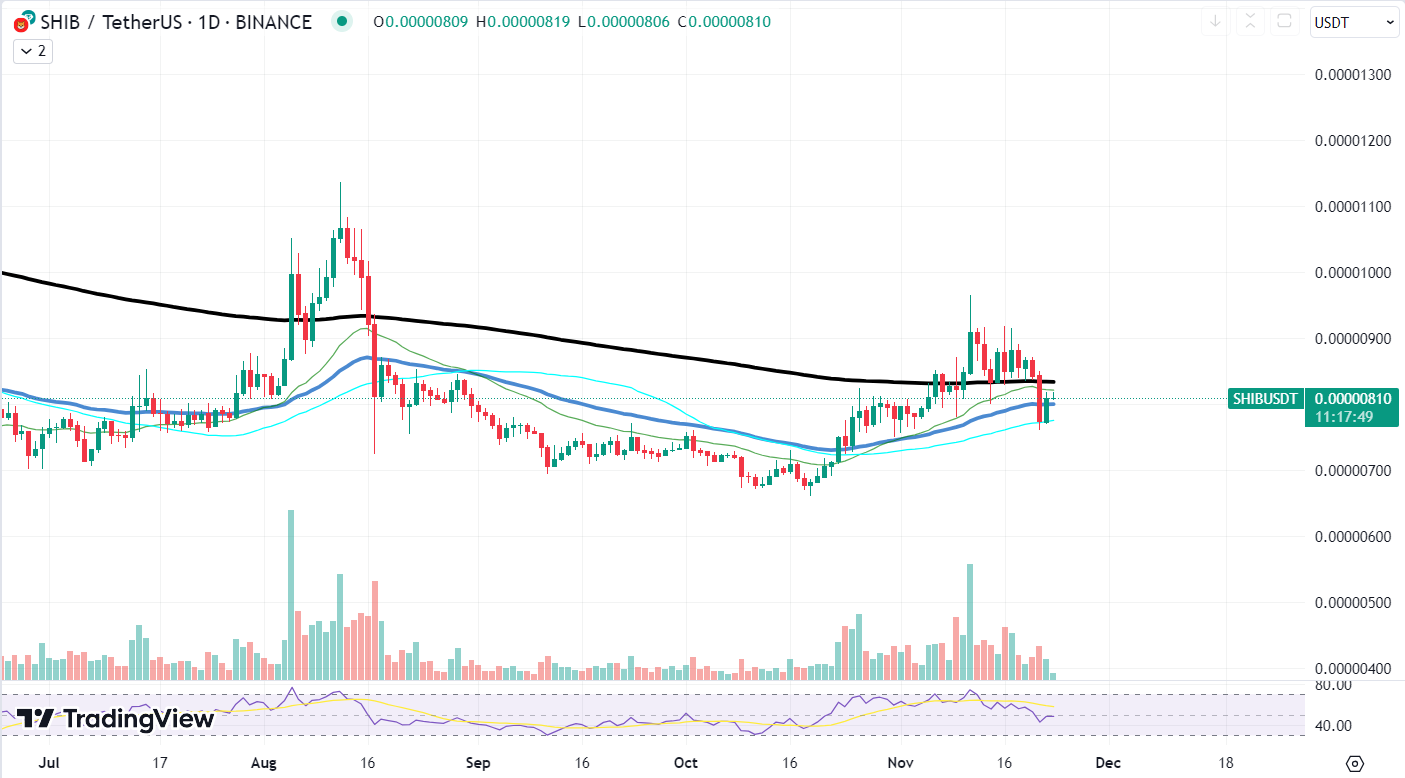
However, the concern for SHIB investors is the asset's failure to maintain ground above the highlighted price threshold. After reaching for the resistance, SHIB faced a breakdown, retracing to lower support levels. This pattern suggests bearish sentiment or a lack of sufficient buying pressure to sustain higher price levels.
The breakdown from the resistance level indicates a problematic outlook for SHIB's foreseeable future. If the asset cannot muster the necessary momentum to break and hold above this level, it may be indicative of a consolidation phase or, worse, a bearish downturn. The moving averages are converging, suggesting that the price action is tightening and that a significant move could be imminent.
Bitcoin shows bullish formation
Bitcoin (BTC), the flagship cryptocurrency, is showcasing a bullish formation on the charts, navigating within an ascending channel that has been intact for several weeks. As BTC approaches a crucial local resistance, the market is attentively watching to see if this upward trajectory can be sustained.
The local resistance at the upper boundary of the channel has proven to be a tough nut to crack in previous attempts. A break above this line could signal a continuation of the bull run, potentially leading to a test of higher resistance levels that have not been touched in months. Conversely, failure to break through could see BTC's price retrace to lower support levels within the channel.

Crucially, the 21-day Exponential Moving Average (EMA) has been acting as a dynamic support level for Bitcoin. Its position just below the current price provides a safety net for short-term pullbacks and reassures buyers that the trend remains in their favor.
Analyzing the volume profiles alongside the price action, there is a noticeable pattern. During upward movements within the channel, buying volumes have been robust, suggesting genuine interest and commitment from buyers.
XRP recovery around corner
The digital asset has been locked in consolidation, but current indicators hint at a potential recovery phase that might be set in motion.
The price of XRP has been oscillating around a key psychological level, often returning to it as if tethered by an invisible elastic band. The recent bounce from the 50-day Exponential Moving Average (EMA) is a positive sign for bulls.
A descending volume profile accompanies this price action, which is often indicative of reduced selling pressure. In the context of a bounce from a major EMA, this could signal a waning bearish momentum. For traders and investors, the convergence of these factors might suggest that the stage is being set for a rally.
The 50 EMA is not just a line on a chart; it is a reflection of the average outcome of price actions and sentiment over the last 50 days, smoothed out to give traders a clearer view of the trend.
The current position of XRP, just above the 50 EMA, presents an opportunity for buyers. Should the price maintain above this level and volume begin to pick up, it could signal the start of a new uptrend. The crypto community knows all too well that XRP has the propensity to make significant moves in a relatively short time frame, leaving little time for those on the sidelines to enter.
 Dan Burgin
 U.Today Editorial Team