
Disclaimer: The opinions expressed by our writers are their own and do not represent the views of U.Today. The financial and market information provided on U.Today is intended for informational purposes only. U.Today is not liable for any financial losses incurred while trading cryptocurrencies. Conduct your own research by contacting financial experts before making any investment decisions. We believe that all content is accurate as of the date of publication, but certain offers mentioned may no longer be available.
A major turning point for the cryptocurrency market was recently reached by Bitcoin, which reached an all-time high on one of its most important charts. In order to highlight the macroeconomic factors driving Bitcoin's current bull run, the chart in question shows the relationship between global liquidity (M2) and the price of the cryptocurrency.
At the moment, Bitcoin is trading at roughly $70,868 - clearly on the rise. A strong bullish trend is evident in the chart, which shows a sequence of higher highs and lows. Moving averages are among the key technical indicators that point to further upward pressure.
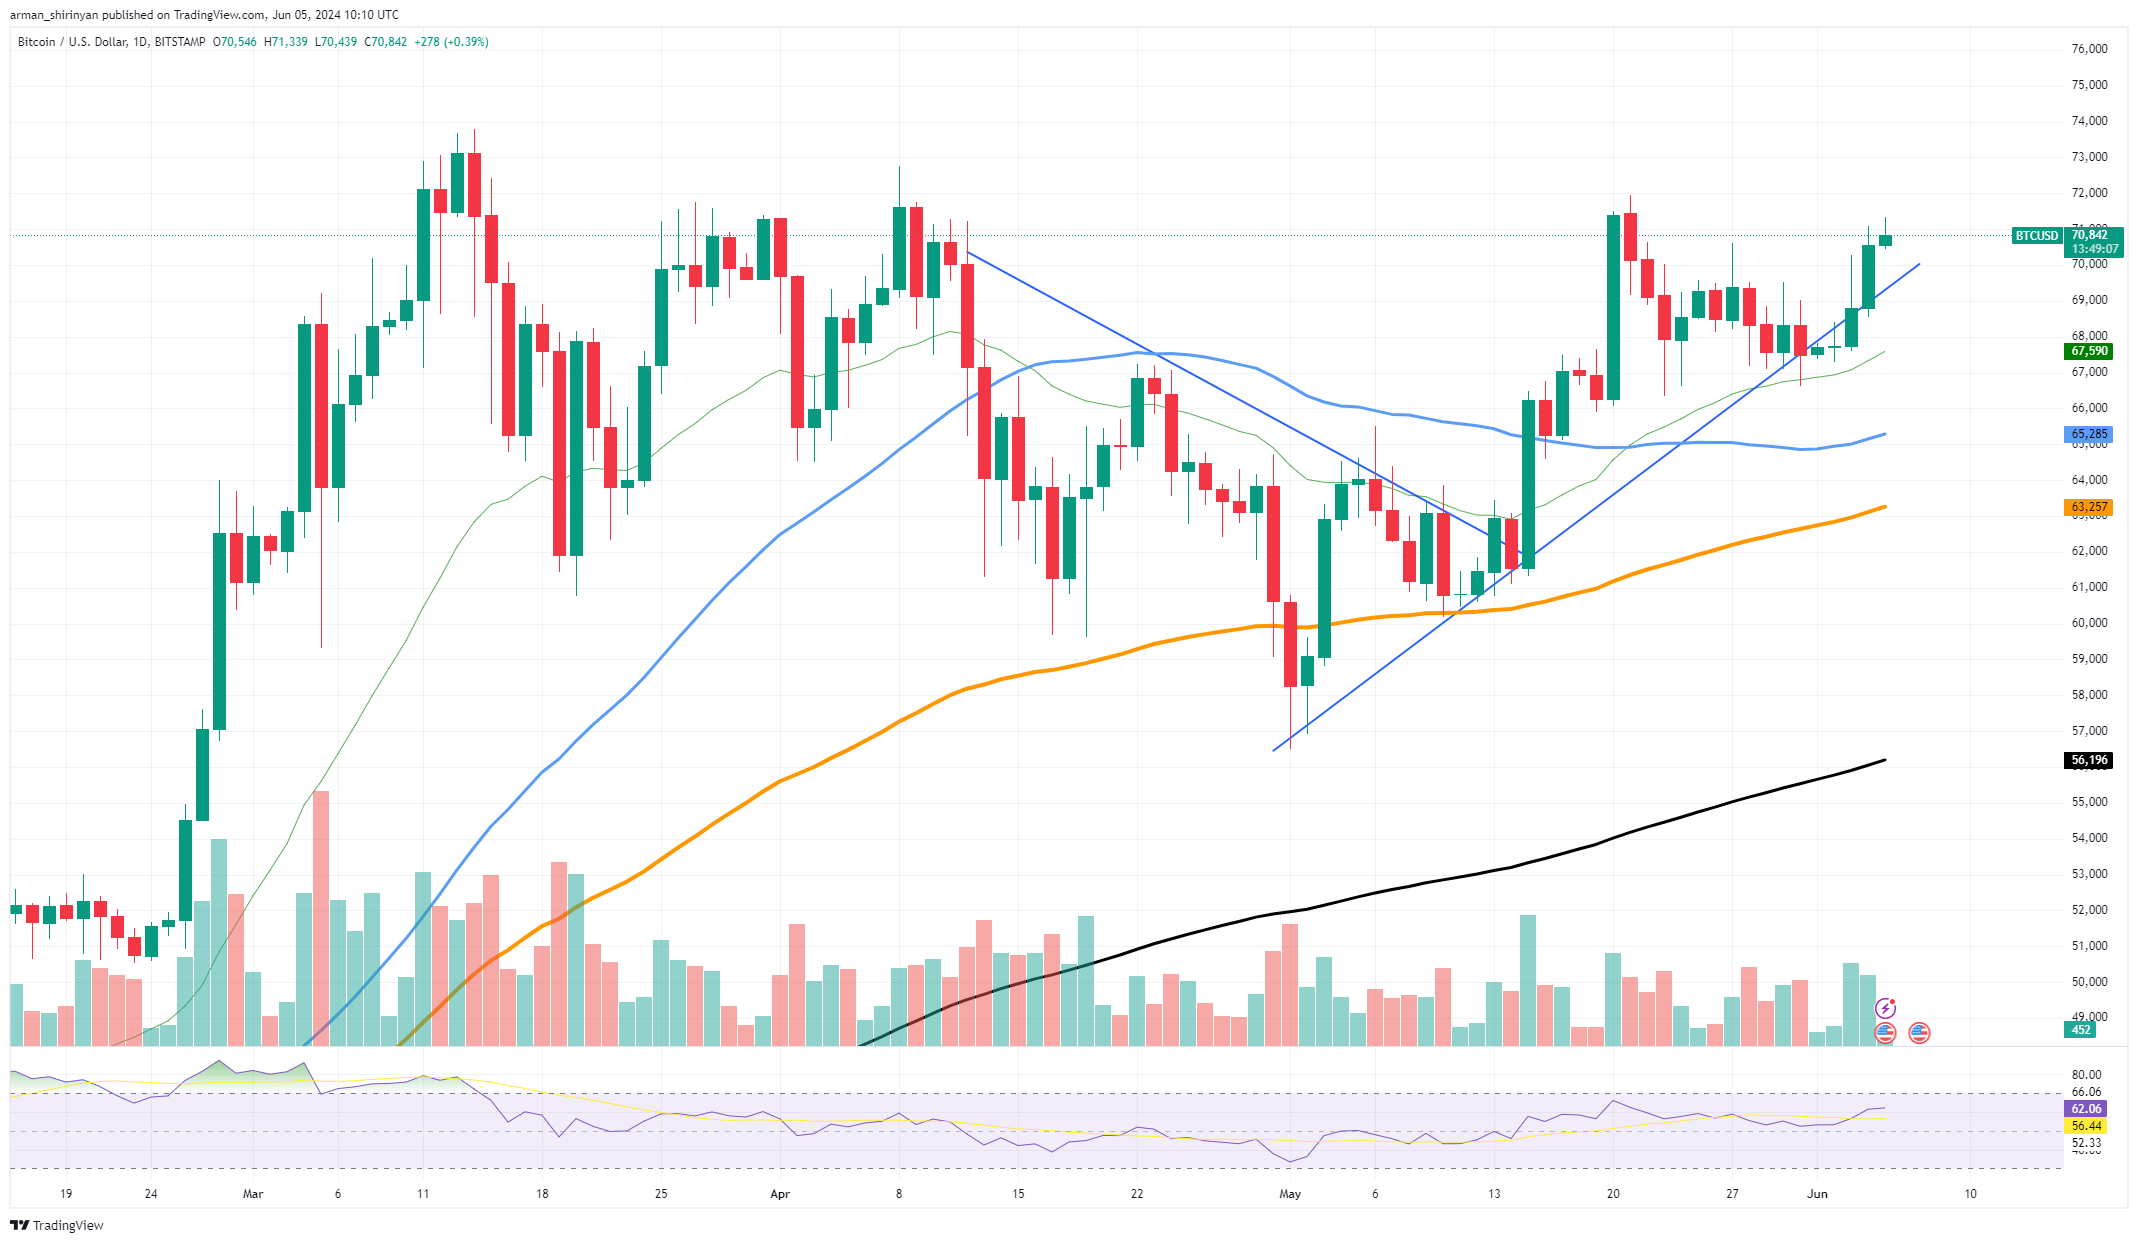
By breaking through key resistance levels, the price has solidified its position above $70,000. Growing trading volumes, which indicate strong buying interest, are supporting this breakout. A more comprehensive view is offered by the second chart, which displays the price of Bitcoin in relation to global liquidity (M2).
With a staggering $94 trillion in global liquidity, the price of Bitcoin closely follows it. In the past, growing Bitcoin prices have frequently coincided with increases in worldwide liquidity. This relationship highlights Bitcoins as a store of value and a hedge against inflation in a time of loose monetary policy. Aggressive monetary policies by central banks in response to economic difficulties are primarily to blame for the spike in global liquidity.

Investors are looking to Bitcoin as a hedge against the possible devaluation of fiat currencies as a result of the unprecedented amounts of money being pumped into the global economy. The market's increased confidence in Bitcoin's long-term value proposition is reflected in the price of the cryptocurrency, which has reached local highs as a result of this liquidity inflow. Technical analysis indicates that there are multiple bullish indicators on the price chart of Bitcoin.
The daily chart's moving averages confirm the bullish trend further, with the 50-day moving average moving above the 200-day moving average. Further more, with higher volumes on up days compared to down days, the volume trends support the price action.
 Dan Burgin
 U.Today Editorial Team