
Disclaimer: The opinions expressed by our writers are their own and do not represent the views of U.Today. The financial and market information provided on U.Today is intended for informational purposes only. U.Today is not liable for any financial losses incurred while trading cryptocurrencies. Conduct your own research by contacting financial experts before making any investment decisions. We believe that all content is accurate as of the date of publication, but certain offers mentioned may no longer be available.
XRP is currently drawing attention from the crypto market, as its price dynamics evolve. An analysis of the recent XRP price chart provides some crucial insights that may guide our understanding of its future trajectory.
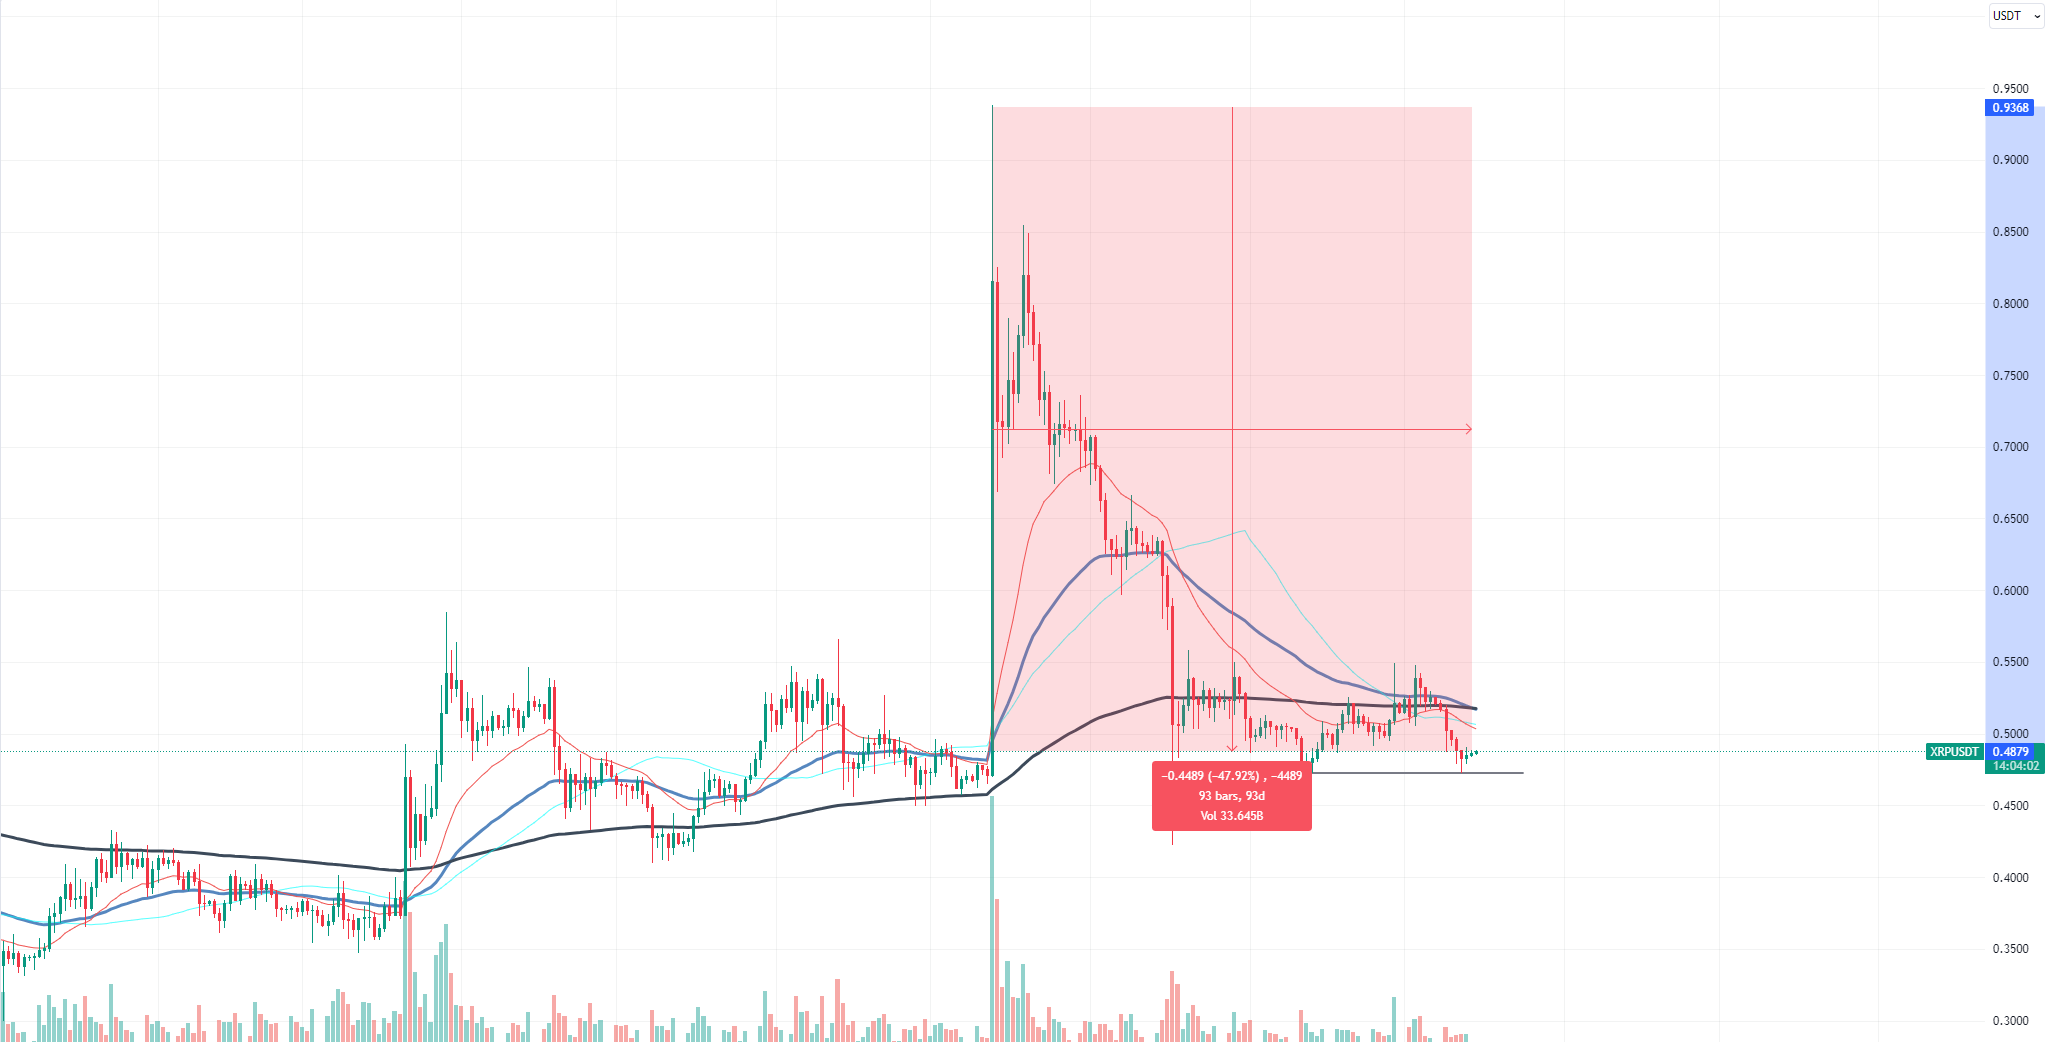
The immediate observation is that XRP has reached a pivotal support level, hovering around the $0.473 mark. This price level could be crucial for the cryptocurrency in the short term. Historically, support levels act as a cushion, preventing the price from plummeting further. If XRP manages to maintain its position above this line, it could signify that a robust buying interest exists around this price point. On the other hand, a breach below could pave the way for further declines.
However, a concerning observation from the chart is the looming "death cross." For the uninitiated, a death cross occurs when a short-term moving average (like the 50-day MA) crosses below a long-term moving average (like the 200-day MA).
This bearish signal has often been associated with potential downtrends and can be indicative of waning momentum. On the XRP chart, the blue and orange lines representing these moving averages are inching closer, suggesting that the death cross might materialize soon.
The volume bars at the bottom of the chart provide another perspective. They represent the number of XRP traded on specific days. Comparing this with price movements, there does not appear to be a massive surge in selling volumes, which is somewhat reassuring for XRP holders.
Ethereum to continue going down
Ethereum, as one of the leading cryptocurrencies, has always been under the watchful eyes of investors and traders. Its recent price behavior, as seen in the provided chart, raises some eyebrows and prompts deeper analysis.
From the outset, Ethereum's price movement indicates downward pressure. While it is showing some resilience around the $1,575 zone, the continuous testing of this support suggests a potential breakdown. If ETH fails to maintain this stance, the road toward the $1,400 mark might be its next destination.

Another noteworthy aspect from the chart is the presence of moving averages trending downward, signaling bearish momentum. Moreover, the price is predominantly trading below these averages, further affirming the prevailing bearish sentiment.
The volume patterns also offer some insights. Without any substantial increase in buying volume to push the price upward, Ethereum might continue its bearish journey.
To sum it up, while the $1,575 mark acts as a temporary support, the overarching bearish patterns and downward moving averages hint at a possible dip toward the $1,400 level. As always, investors should keep an eye out for key support and resistance levels and be prepared for any sudden shifts in market dynamics.
Shiba Inu shows signs of life
Shiba Inu (SHIB) has started to show signs of life after a period of consolidation. A recent analysis of the SHIB chart indicates that it is currently grappling with a new resistance level, hinting at the critical role the 21 exponential moving average (EMA) plays in determining its immediate future.
Upon close inspection, the SHIB price has tested the 21 EMA, a common technical indicator used by traders to gauge potential price movements. The recent touch of the 21 EMA can lead to two possible scenarios:
Bullish breakout: If SHIB manages to break and maintain above the 21 EMA, it could indicate bullish momentum for the token. Such a breakout, coupled with increased buying volume, can potentially propel the token to test higher resistance levels, setting the stage for a new rally.
Bearish rejection: On the flip side, should SHIB get rejected at the 21 EMA and fail to maintain a position above it, a potential downtrend could ensue. This scenario might see the token retesting previous support levels. Traders would be wise to keep an eye on the volume during this period, as decreased buying activity could further affirm the bearish stance.
 Dan Burgin
 U.Today Editorial Team