
After breaking $150 resistance, Ethereum has become steadier and now keeps moving up having reached a price of $180 recently. Should we sell it right now, or is there a chance for it to grow even higher? Read Ethereum price predictions from TradingView users to find out how ETH will act in the following days and weeks.
This bull run leads us to $300
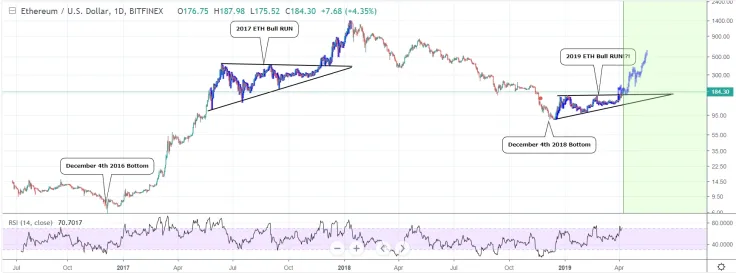
Look at these patterns: in 2017 Ethereum made the same move and ended up reaching its price record of $1,400+. Should we wait for the same breakout now? Yes, but ETH is highly unlikely to reach such heights – we should target at least $300 for now. Surely, this threshold will be achieved if nothing affects the overall cryptocurrency market.
ETH on the way to another resistance level
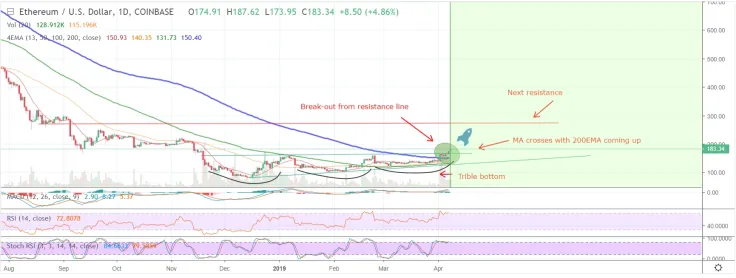
According to MrCarstenF, ETH is on the verge of breaking out, and it may happen very soon since next resistance level is under pressure from crossings of EMA in an upward direction with a golden cross lurking close by.
A healthy bottom is formed and there is less resistance at November level, but it may require a few attempts including retracements to break before moving the next consolidation level between $200-350.
Has it been a false breakout?
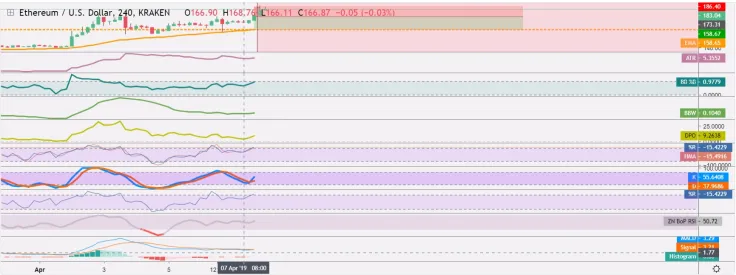
The first thing that we can observe on CryptoMedication’s price chart for Ethereum on the daily resolution is that the EMA-200 (purple line) is looming directly overhead to serve as resistance for further price action. There’s a potential ascending triangle formation.
Many have noticed what appears to be the makings of an ascending triangle (flat-top triangle). These are bullish continuation/reversal patterns that often lead to major gains. The fulfillment of this pattern led to Bitcoin’s massive gains.
From what we can see above, the current price action for Ethereum does have all of the trappings of a flat-top triangle. At first glance, the current day’s price action reflects a true breakout. But the volume does not match breakout! This is a classic sign of a false breakout – the strong overhead resistance that will undoubtedly be posed by the EMA-200 on the daily resolution.
Without creating too lengthy of an exposition, we’re going to go ahead and opt for a short position on this trade, using the EMA-50 value on the H4 resolution.
ETH/BTC – hot time for trading
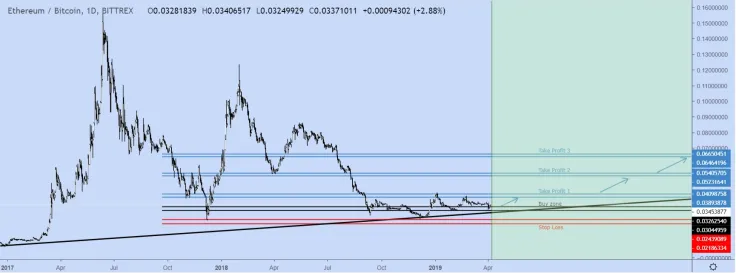
Let’s not forget that ETH/BTC is one more great opportunity for traders. So, how to reap maximum benefits from it? Look at the chart!
Suggestive Position
- Entry = Trigger (according to trading strategy)
- Stop-loss =0.021-0.024
- Take Profit 1 =0.038-0.040
- Take Profit 2 =0.052-0.054
- Take Profit 3 =0.064-0.066
- Reward/Risk= 1
As we see, Ethereum has only started its overwhelming growth and is heading to the next target of $300. Will it reach this position? It’s very likely to be driven by the overall cryptocurrency market bullish trends. The lack of volume poses a true threat to Ethereum’s development – everything might be lost in a jiffy. Right now, you can still buy some ETH and wait for your investments to be increased by 50-100%.
 Dan Burgin