Disclaimer: The opinions expressed by our writers are their own and do not represent the views of U.Today. The financial and market information provided on U.Today is intended for informational purposes only. U.Today is not liable for any financial losses incurred while trading cryptocurrencies. Conduct your own research by contacting financial experts before making any investment decisions. We believe that all content is accurate as of the date of publication, but certain offers mentioned may no longer be available.
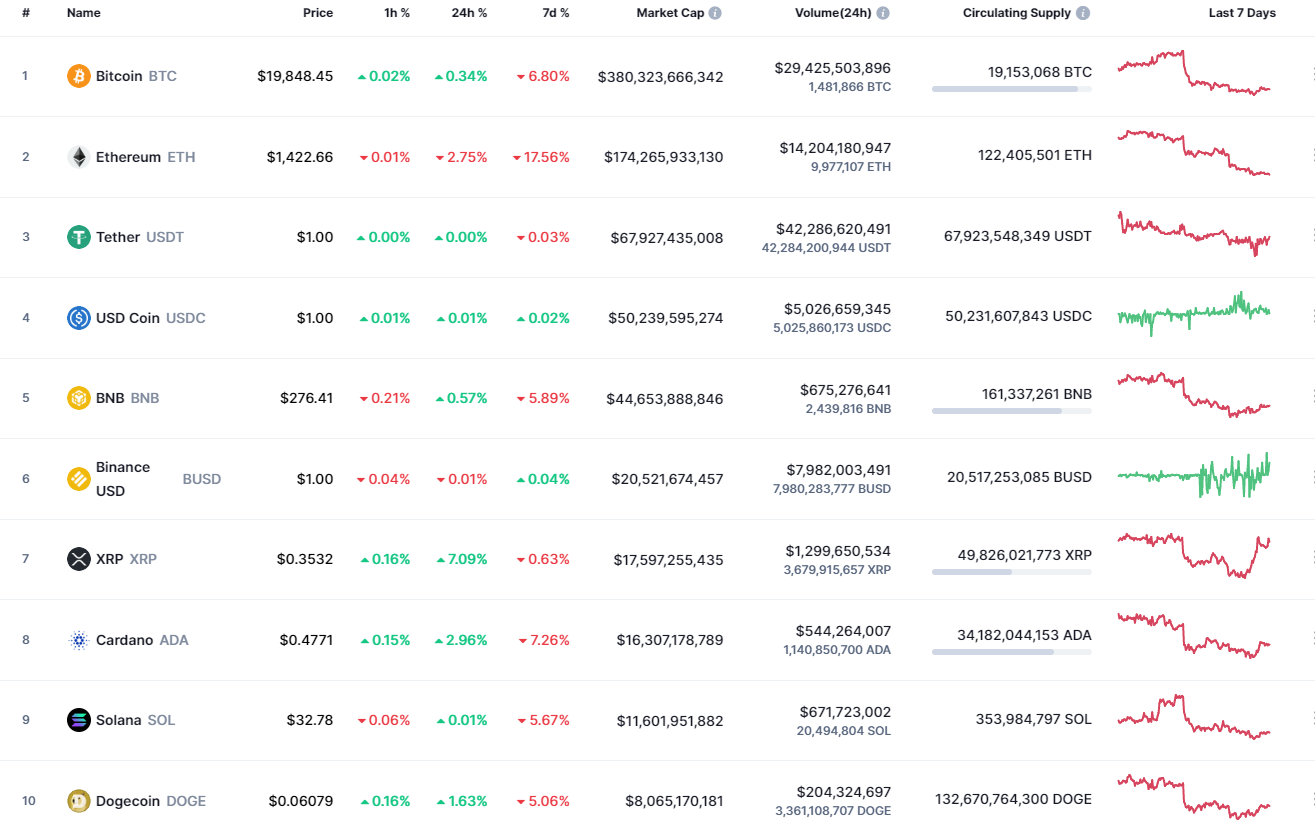
The weekend has started with a correction on the cryptocurrency market as most of the coins are in the green zone again.
ETH/USD
Unlike other digital assets, Ethereum (ETH) keeps falling, going down by 2.75%.
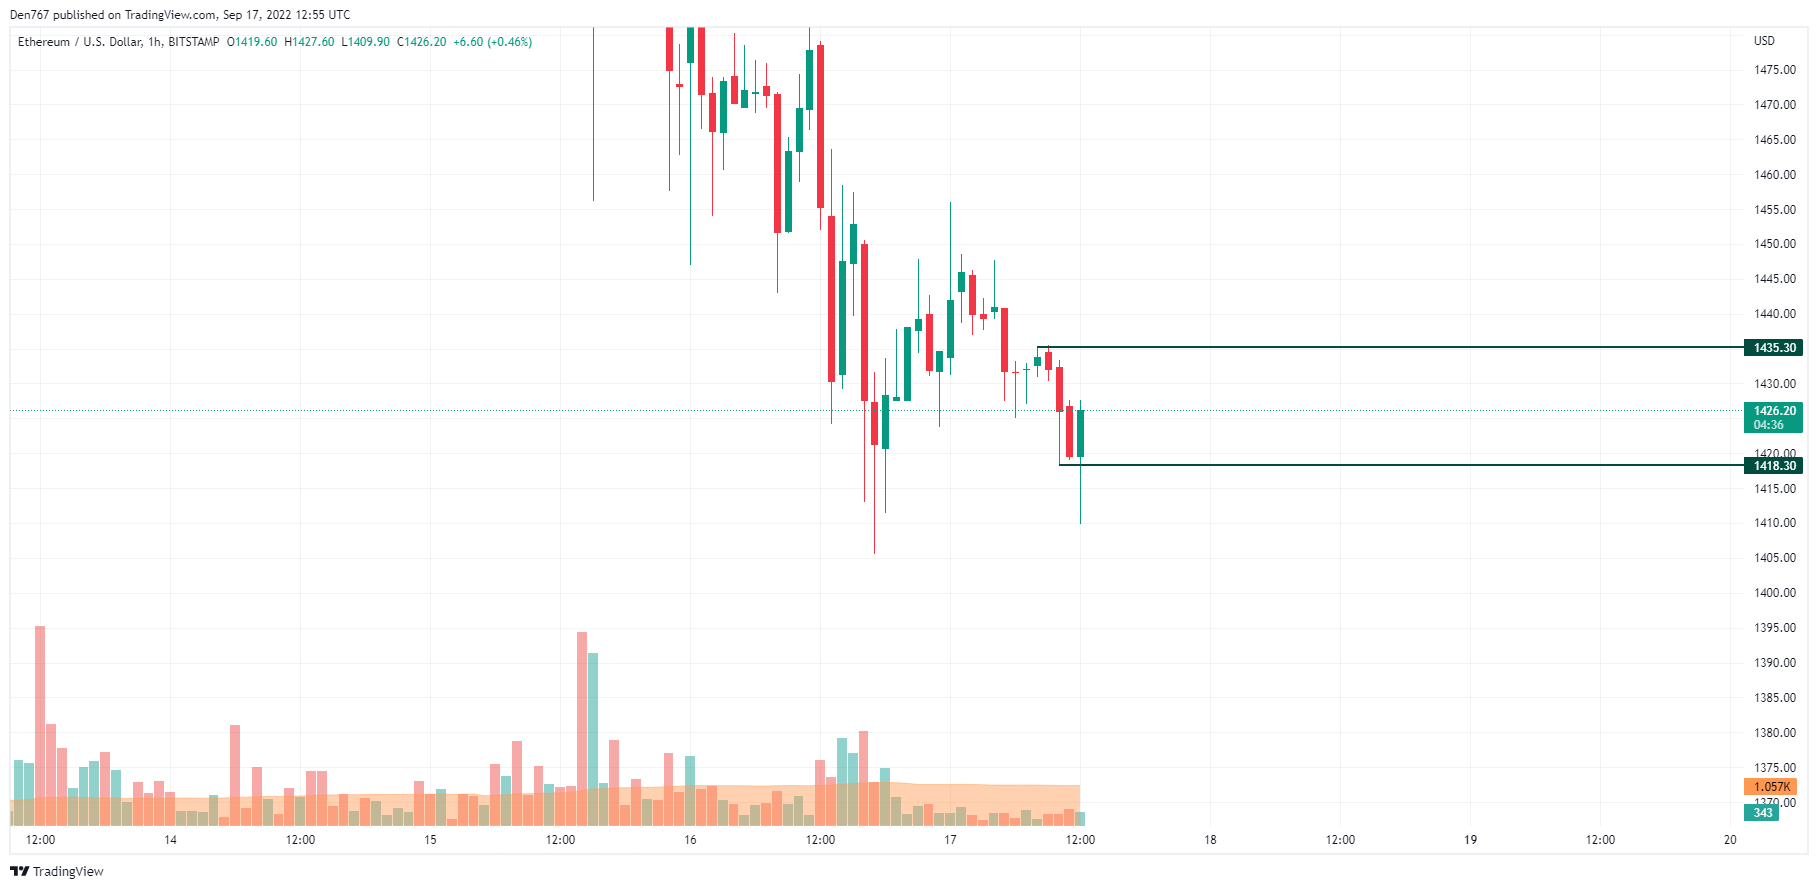
On the hourly time frame, Ethereum (ETH) has made a false breakout of the support level at $1,418 against the increased volume. If buyers can hold this zone, there is a chance to see a test of the resistance at $1,435 shortly.
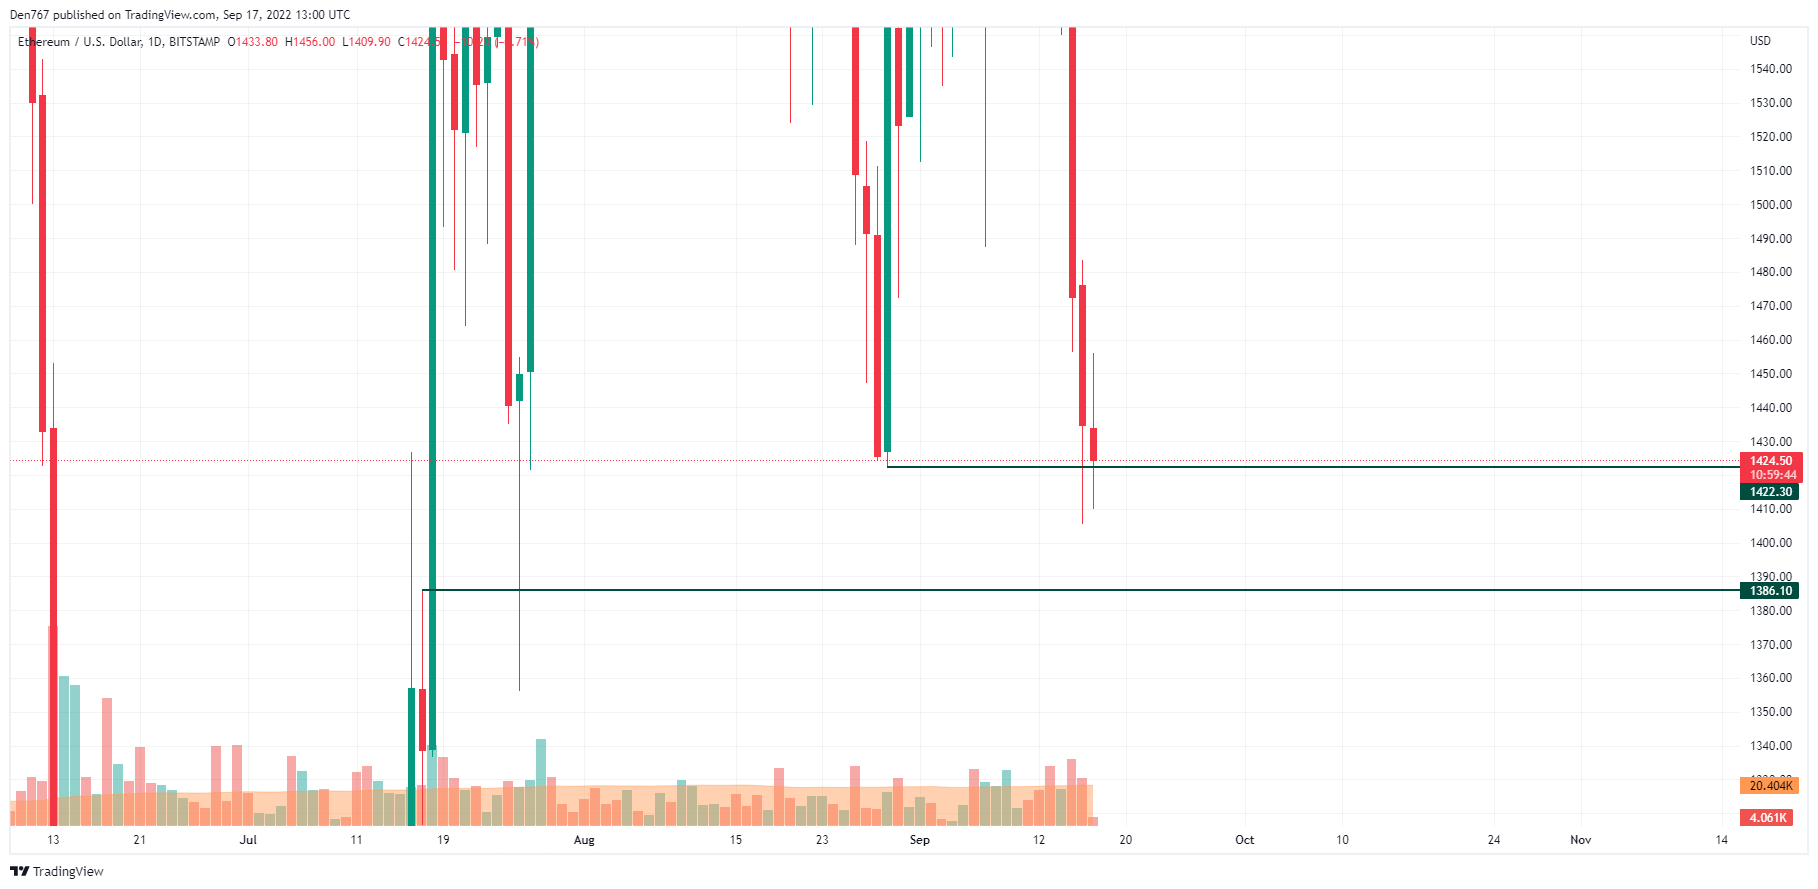
On the daily chart, Ethereum (ETH) is looking bearish as the price is very close to the support level at $1,422. If the candle closes below it, it might a reason for a sharp drop to the $1,400 area next week.
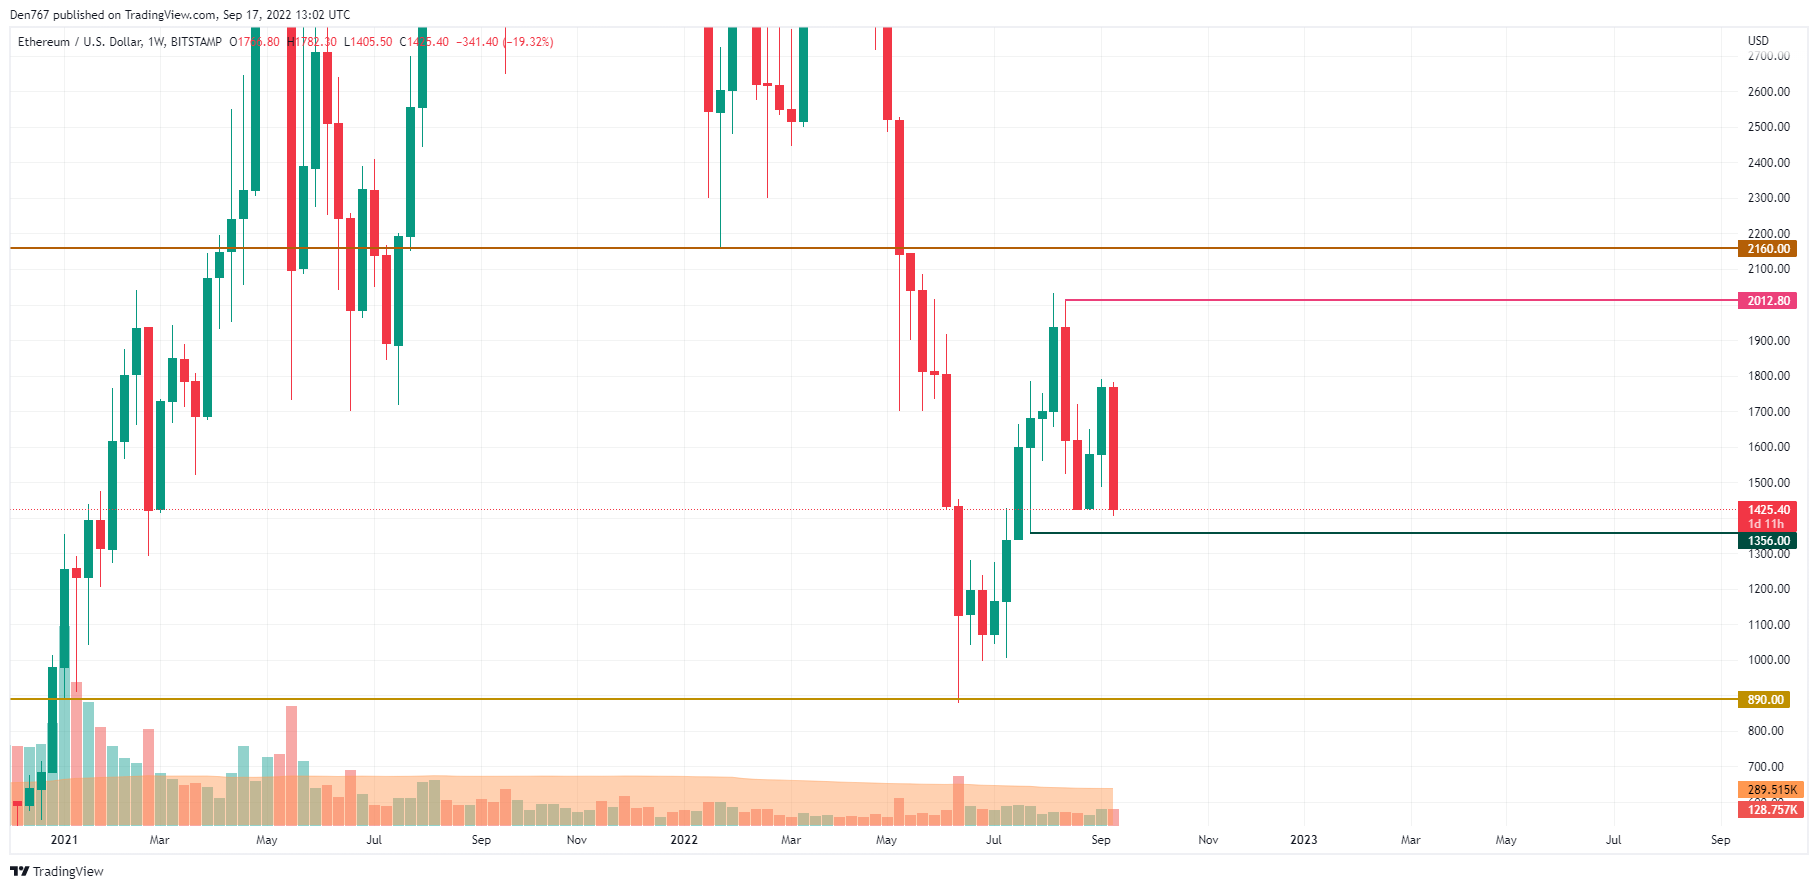
The situation is similar on the weekly chart as Ethereum (ETH) is likely to close below the psychological $1,500 mark. Respectively, the upcoming week might also be bearish for the main altcoin, so traders can expect to see a decline to the $1,356 mark.
Ethereum is trading at $1,426 at press time.
 Dan Burgin