Disclaimer: The opinions expressed by our writers are their own and do not represent the views of U.Today. The financial and market information provided on U.Today is intended for informational purposes only. U.Today is not liable for any financial losses incurred while trading cryptocurrencies. Conduct your own research by contacting financial experts before making any investment decisions. We believe that all content is accurate as of the date of publication, but certain offers mentioned may no longer be available.
Ethereum is under severe downward pressure due to its ongoing price decline. The 200-day Exponential Moving Average, which is frequently seen as a solid support line, was recently tested by the cryptocurrency. If Ethereum breaks below this barrier, more bearish momentum may be indicated.
The uncertainty surrounding the approval of Ethereum ETFs contributed to the recent sell-off. The market has become more volatile as a result of investor expectations and subsequent disappointment. Due to ETH's difficulty sustaining its prior support levels as traders respond to these developments, selling pressure has intensified. Watching for the possible formation of a death cross is one of the most important technical indicators.
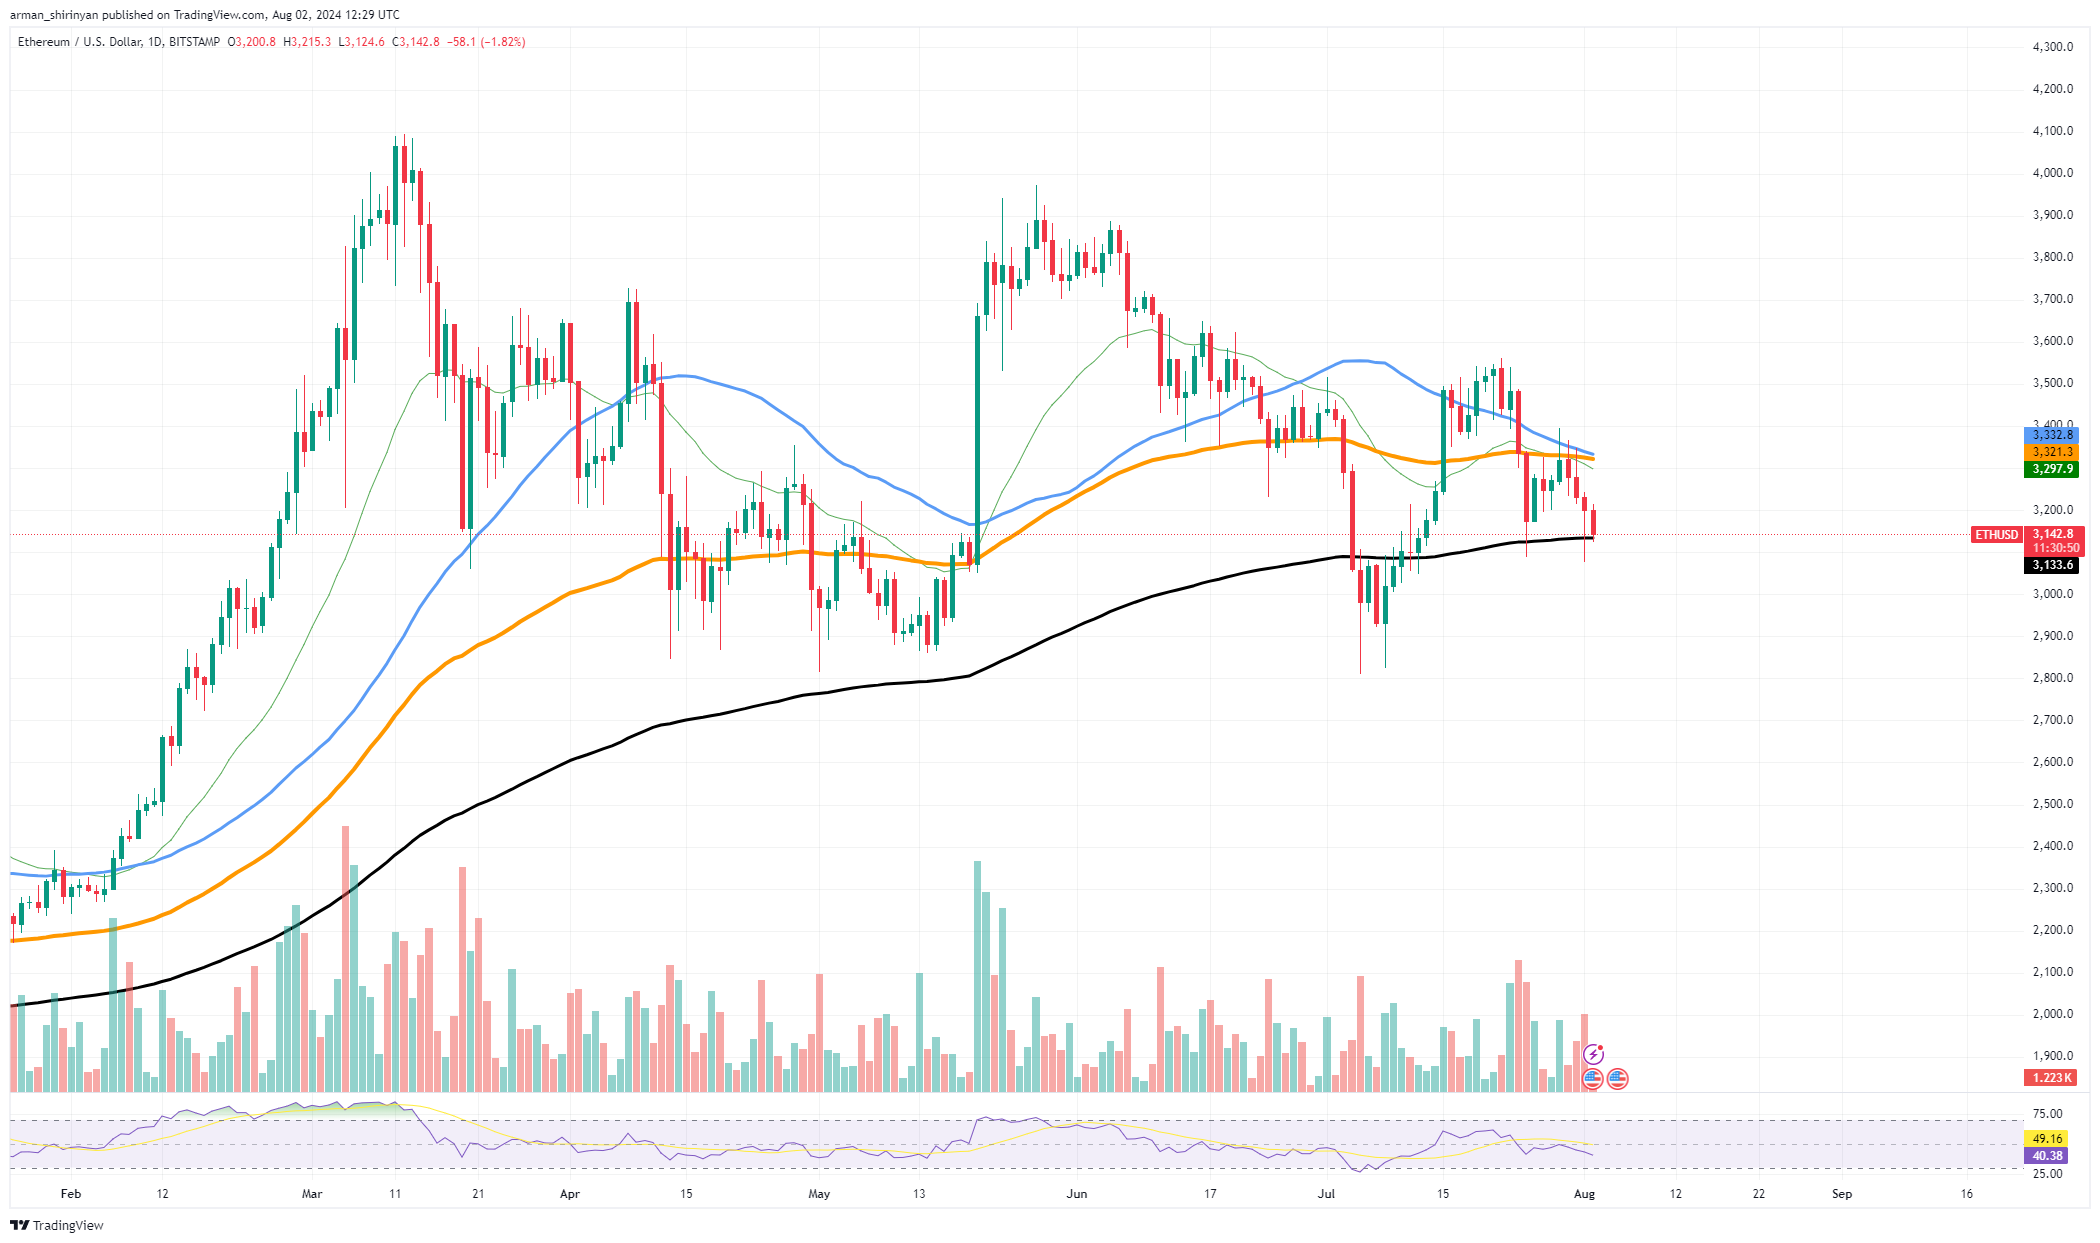
When the long-term moving average crosses below the short-term moving average, it indicates a change in the trend from bullish to bearish. The 200-day EMA and the 50-day EMA are currently convergent. Should this crossover occur, it may signify an extended downward trend for Ethereum, thereby causing additional market instability.
ETH is clearly in a downward trend, as evidenced by the price chart, which breaks below the 200-day EMA. There has been a notable increase in trading volume, indicating that there is substantial market participation driving the sell-off.

Additionally, the Relative Strength Index is trending lower, suggesting that the sellers currently have the momentum. Technical indicators present a difficult short-term picture despite the strength of Ethereum's fundamentals. The possible death cross adds to the pessimistic outlook, and the market sentiment has turned cautious. To predict the next move, traders and investors will be closely observing the price action around the 200-day EMA.
XRP has failed
After touching the $0.65 barrier, XRP's price recently suffered a severe decline. Investors are worried about this drop, especially considering the pattern it followed — a price chart breakdown from a triangle formation. These signals suggest that XRP may still have some bullish momentum left in spite of this setback.
XRP's price shot up to $0.65, a level it had not seen in months, raising hopes for a long-term upswing. This upward trajectory, though, was fleeting. The price quickly reversed course and broke out of the ascending triangle pattern that had developed. As suggested by the moving averages, this technical breakdown points to the possibility of additional declines, possibly testing lower support levels around $0.55 and $0.51.

Profit-taking and a broader market correction are to blame for the abrupt sell-off. The fact that there was a significant increase in trading volume during this decline suggests that many traders were quick to liquidate their positions when XRP was unable to hold the $0.65 level. RSI also revealed a drop, indicating a reduction in buying momentum, as it moved out of the overbought area and back into the mid-range.
There is still some hope for XRP despite the current bearish signals. Beginning in the middle of July, the general uptrend is still in place. The short-term moving averages are above the longer-term ones in a bullish configuration, indicating that the market's overall sentiment toward XRP is still positive.
Shiba Inu pushed down
Lately Shiba Inu has been under a lot of strain, managing a downward trajectory that has seen its value drop by 25%. One of the main causes of this ongoing decline is the ongoing downward trend, which worries investors about the token's prospects going forward. By examining the given chart, it is evident that SHIB has been held back for a number of months in a downward trend.
The resistance has resisted every attempt to break out, driving the price lower. This channel, which is characterized by lower highs and lower lows, makes it difficult for any bullish reversal attempts to occur. A dismal picture is also painted by the moving averages. The significant resistance levels that SHIB is currently trading below are the 50, 100 and 200-day exponential moving averages.

In particular, SHIB has had difficulty staying above the 200 EMA, a crucial level that emphasizes the general pessimistic outlook on the market. The overall state of the market is among the factors that are contributing to this downtrend. Meme coins such as SHIB are especially vulnerable to these swings, and the entire cryptocurrency market has encountered challenges.
Furthermore, SHIB is more susceptible to speculative trading and changes in market sentiment due to its lack of significant utility in comparison to other cryptocurrencies. The volume analysis reveals a decrease, suggesting that there is insufficient buying interest to sustain a price recovery.
 Dan Burgin
 U.Today Editorial Team