Disclaimer: The opinions expressed by our writers are their own and do not represent the views of U.Today. The financial and market information provided on U.Today is intended for informational purposes only. U.Today is not liable for any financial losses incurred while trading cryptocurrencies. Conduct your own research by contacting financial experts before making any investment decisions. We believe that all content is accurate as of the date of publication, but certain offers mentioned may no longer be available.
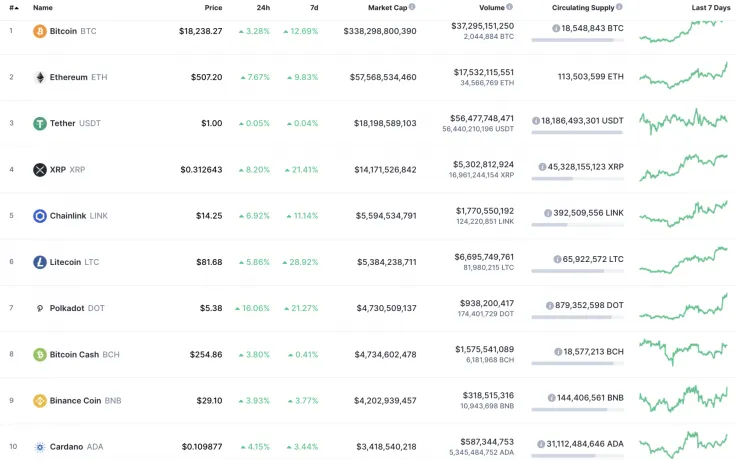
Bulls have seized the initiative as all Top 10 coins have come back to the green zone. Polkadot (DOT) is the top gainer among them, rising by 16% since yesterday.
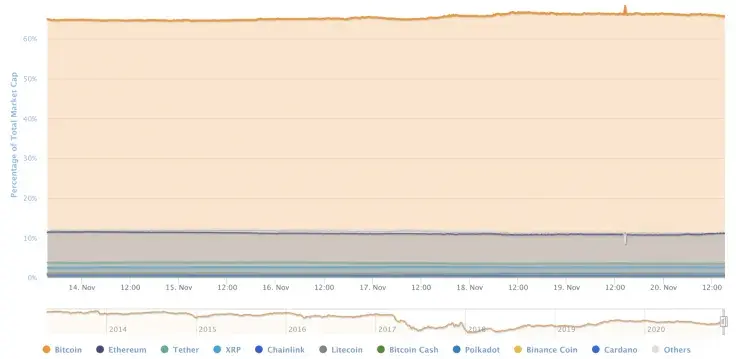
Even though the altcoins are showing a significant price rise, the market share of the main crypto keeps going up and is now 65.6%.
The relevant data of Bitcoin is looking the following way today:
-
Name: Bitcoin
Advertisement -
Ticker: BTC
-
Market Cap: $337,912,366,671
-
Price: $18,217.44
Advertisement -
Volume (24h): $37,013,049,067
-
Change (24h): 3.03%
The data is relevant at press time.
BTC/USD: Any prerequisites to attain $19,000 next week?
Yesterday, in the first half of the day, sellers pierced the support of the hourly EMA55 but failed to consolidate below average prices. In the second half of the day, buyers restored the pair above the psychological mark of $18,000; however, by the end of the day, the volume of purchases decreased, and the growth failed to continue at night.
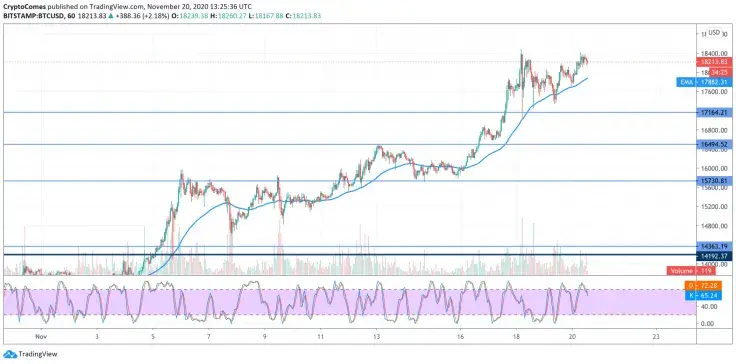
This morning bulls are trying to continue the run using the support of the EMA55 moving average. If market participants believe in growth and support the growth with large purchases, then a new annual maximum is possible around $19,000.
On the other hand, it should be taken into account that bears can increase the onslaught at the level of $18,500, and then they may break through the support of the average price level, returning the pair to the area of $16,600.
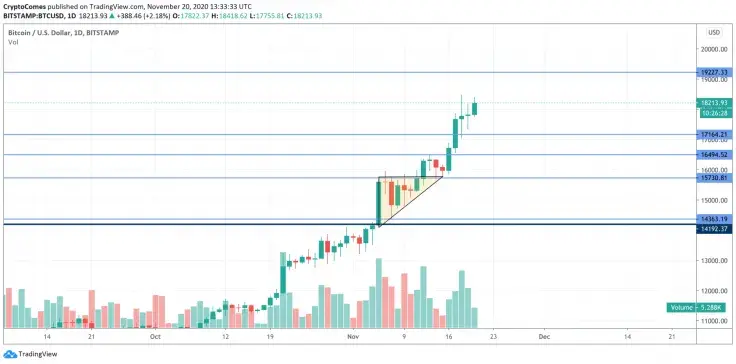
Bitcoin (BTC) managed to catch very strong support in the $17,400- $17,500 zone and tested it several times already, which may indicate that the bulls are not planning to give up before taking a historic high. The descending triangle, which earlier could have indicated a decline, has also broken upwards. Thus, from the technical point of view, everything looks relatively safe. The only resistance on the way to $20,000 is $19,000, which may be an obstacle for bulls.
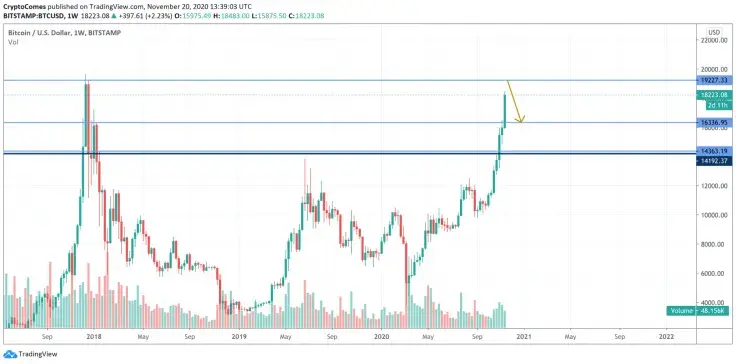
On the weekly chart, a false breakout of the $19,000 zone may lead the rate of Bitcoin (BTC) to the closest support at $16,000. However, that would be just a correction and not a start of the bearish cycle. Such a scenario is relevant for the upcoming weeks.
Bitcoin is trading at $18,281 at press time.
 Dan Burgin
 U.Today Editorial Team