Disclaimer: The opinions expressed by our writers are their own and do not represent the views of U.Today. The financial and market information provided on U.Today is intended for informational purposes only. U.Today is not liable for any financial losses incurred while trading cryptocurrencies. Conduct your own research by contacting financial experts before making any investment decisions. We believe that all content is accurate as of the date of publication, but certain offers mentioned may no longer be available.
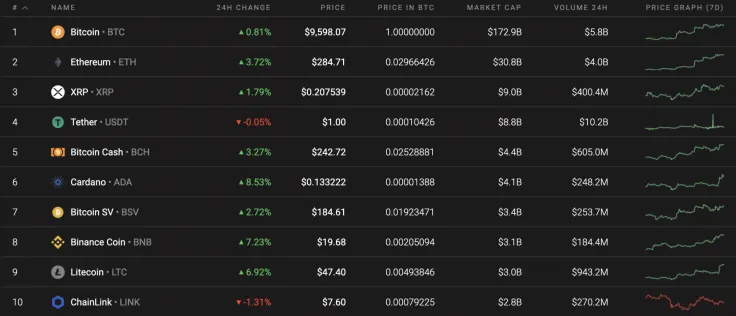
With the ongoing weekend, the cryptocurrency market remains in the green. The only exception to this rally is Chainlink (LINK), which has entered a correction phase and has declined by 1.31% since yesterday.
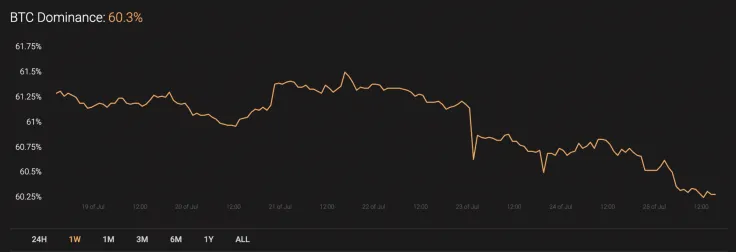
Bitcoin (BTC) has become more volatile this week as compared to previous weeks; however, its market share continues to decline against the sharp growth of altcoins. The dominance rate for the main crypto currently sits at 60.3%.
Below is the relevant data for Bitcoin and how it's looking today:
-
Name: Bitcoin
Advertisement -
Ticker: BTC
-
Market Cap: $176,721,084,634
-
Price: $9,582.49
Advertisement -
Volume (24H): $16,071,975,364
-
Change (24H): 0.72%
BTC/USD: Could Traders See the Main Crypto Near the $9,700 Area Next Week?
It seems that Bitcoin (BTC) is not even going to face a slight decline after failing to attempt to fix above its price the $9,700 mark. The rate for the leading crypto has increased by 4.53% in the last 7 days.
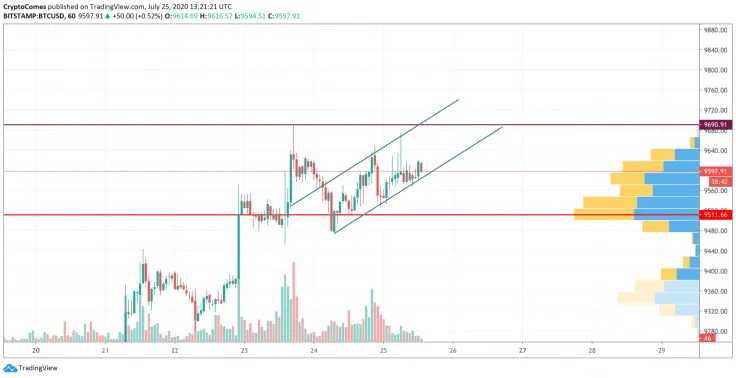
Looking at the hourly time frame, Bitcoin (BTC) continues to be located within the ascending channel and the nearest price target is around $9,700. The growth is unlikely to continue up to the $10,000 mark as the trading volume is already low, as well as its liquidity level. In this particular case, the bulls may bring BTC to the $9,690 mark, creating a false breakout at this level followed by a correction. The following scenario is relevant by the end of weekend.
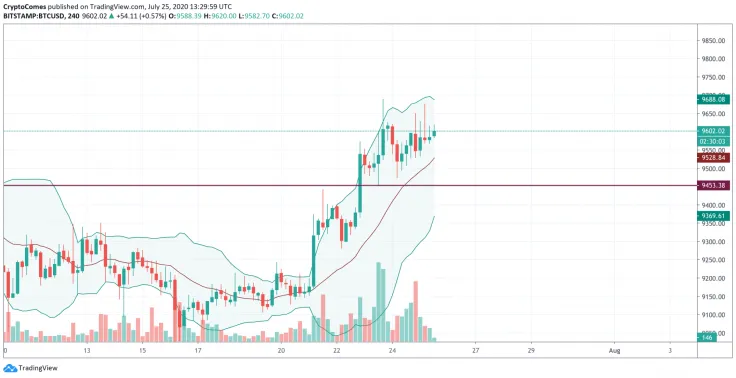
Looking at the 4H time frame, bearish sentiments have appeared as the resistance line from the Bollinger Bands has started to decline. The slight ongoing rise has not been accompanied by an increase in trading volume, which means that buyers have probability of hitting the $10,000 mark for the first time. In this regard, Bitcoin (BTC) may face a correction to its liquidity level of $9,453 to maintain growth.
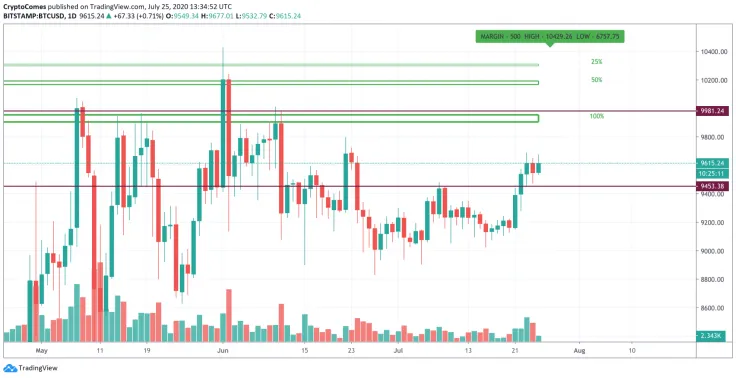
Bitcoin (BTC) has started to move upwards after locating a few in the accumulation phase. The growth is supported by the buying volume, which means that there is a low probability of a false breakout. The nearest aim for traders is to consider the zone around the $9,900 mark. It is a far retest of the level from June 11. In case the bulls are able to above it, then there is a high probability of attaining the psychological point of $10,000 by the end of Summer 2020.
At press time, Bitcoin was trading at $9,573.
 Dan Burgin
 U.Today Editorial Team