
Disclaimer: The opinions expressed by our writers are their own and do not represent the views of U.Today. The financial and market information provided on U.Today is intended for informational purposes only. U.Today is not liable for any financial losses incurred while trading cryptocurrencies. Conduct your own research by contacting financial experts before making any investment decisions. We believe that all content is accurate as of the date of publication, but certain offers mentioned may no longer be available.
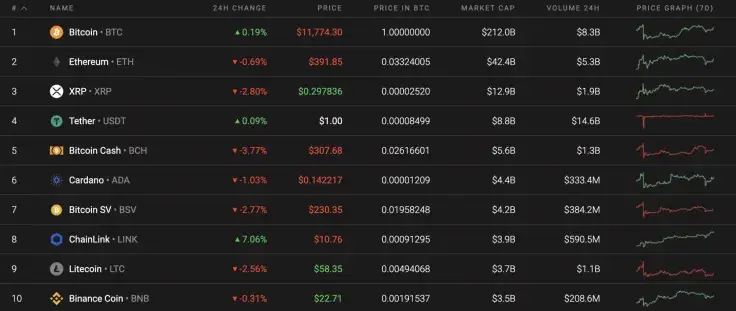
The weekend started out in a relatively neutral setting; however, bearish sentiments have slightly prevailed over the bullish ones. Most of the Top 10 coins are in the red.
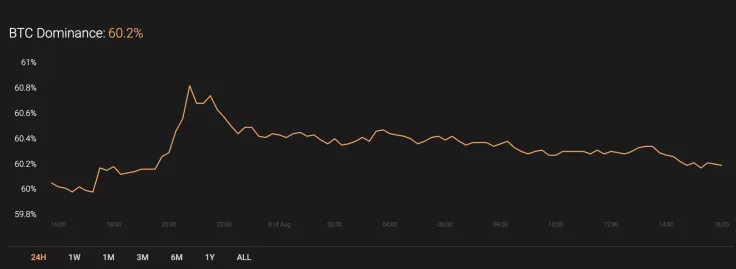
The market share for the leading crypto has remained relatively unchanged since yesterday. The current dominance index for Bitcoin (BTC) makes up 60.2%.
Below is the relevant data for Bitcoin (BTC) and how it's looking today:
-
Name: Bitcoin
Advertisement -
Ticker: BTC
-
Market Cap: $217,198,429,180
-
Price: $11,769.18
Advertisement -
Volume (24H): $21,626,457,111
-
Change (24H): -0.10%
The data was relevant at press time.
BTC/USD: How Big are the Chances of Buyers Breaking $12,000 by mid-August?
The rate for the leading crypto has not been so volatile this week as it was last week. The price change from the last 7 days has constituted a +1.15% increase.
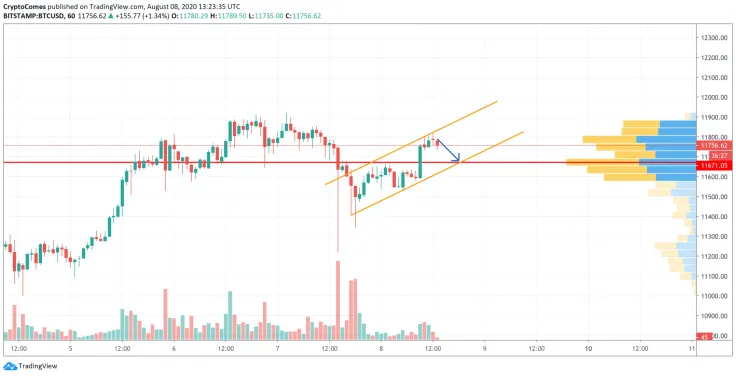
Looking at the hourly chart, Bitcoin (BTC) is trading within the rising channel against low trading volume. On the other hand, the liquidity level is high enough, which means that there is a low probability of seeing a sharp move soon. The main crypto has bounced off the top of the channel, confirming the presence of the bears. In this particular case, traders may see Bitcoin (BTC) trading between the $11,600-$11,650 levels by the end of the week.
Looking at the 4H chart, the growth stopped after a false breakout at the $12,000 mark. For the moment, Bitcoin (BTC) is likely to go down than up as the trading volume continues to decline.
However, a possible decline could be considered as a part of a correction phase, but a not the start of a bearish trend. Only if the main crypto fixes below $9,500 will sellers seize on the initiative.
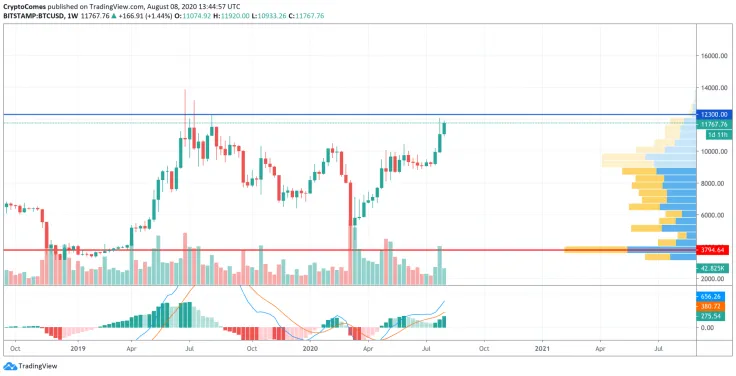
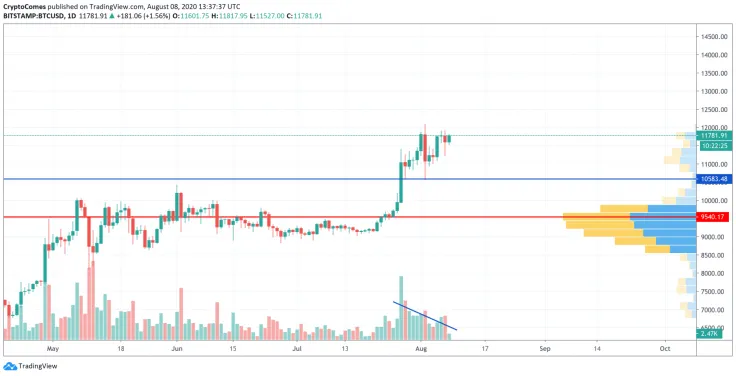
According to the weekly chart, Bitcoin (BTC) confirmed the intention of a continued rise. The Moving Average Convergence/Divergence (MACD) is moving upwards, which means that the bulls are not going to stop the trend. If the trading volume and liquidity continues to move higher, then the chief crypto may target the $12,300 mark within the next few weeks.
At press time, Bitcoin was trading at $11,755.
 Dan Burgin
 U.Today Editorial Team