Disclaimer: The opinions expressed by our writers are their own and do not represent the views of U.Today. The financial and market information provided on U.Today is intended for informational purposes only. U.Today is not liable for any financial losses incurred while trading cryptocurrencies. Conduct your own research by contacting financial experts before making any investment decisions. We believe that all content is accurate as of the date of publication, but certain offers mentioned may no longer be available.
Bulls have seized the initiative in Friday's second half. All top 10 coins have returned to the green zone, even though the growth is not as sharp as it was before.
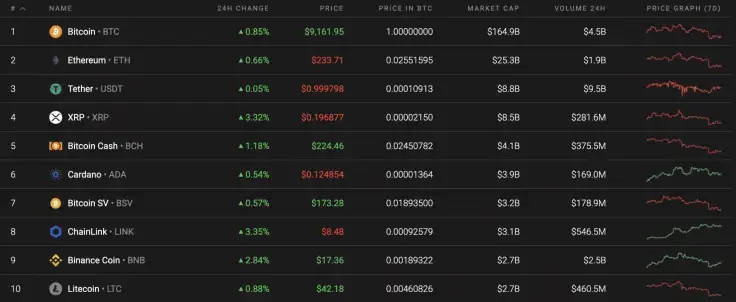
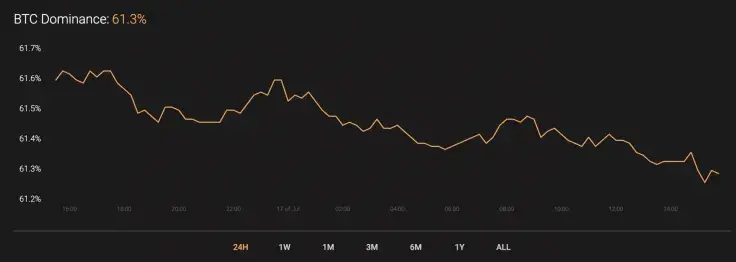
While Bitcoin (BTC) keeps trading between $9,000 and $9,500, its market share is declining as altcoins are more volatile than the leading crypto. The dominance index of BTC makes up 61.3% at the moment.
The relevant data for Bitcoin looks this way today:
-
Name: Bitcoin
Advertisement -
Ticker: BTC
-
Market Cap: $168,797,027,896
-
Price: $9,156.25
Advertisement -
Volume (24h): $14,616,547,209
-
Change (24h): 0.86%
The data is current as of press time.
BTC/USD: Is the current rise a correction of the fall or the start of a new bullish wave?
Bulls have shown strength in the area of $9,050-$9,100 and did not allow Bitcoin (BTC) to fall below the $9,000 mark. However, it is too early to consider a continued rise as buyers need to fix above $9,500 to even consider getting to $10,000.
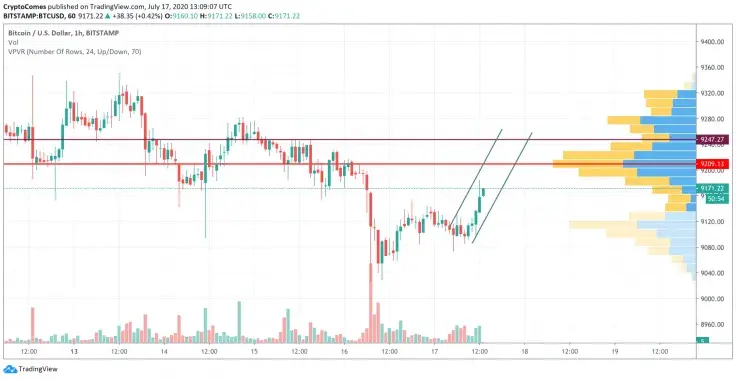
On the hourly chart, Bitcoin (BTC) is bouncing off the support and has entered a short bullish wave. The rise is supported by an increasing trading volume, which means that there are fewer chances for a false breakout. All in all, the growth may continue to the zone of high liquidity at around $9,200-$9,250 until the end of the current week.
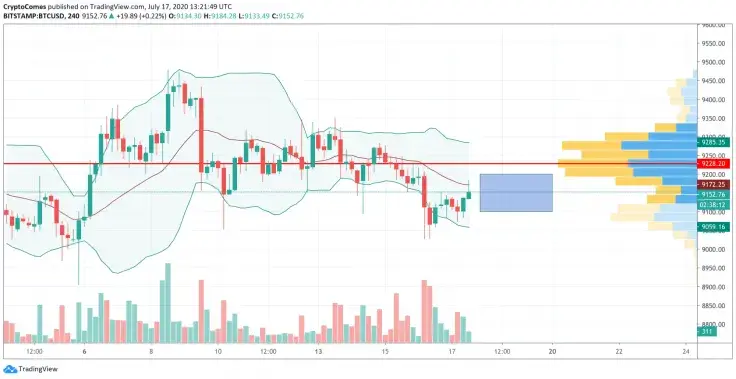
On the 4H time frame, neither bulls nor bears are dominating. The trading volume is not low, however, it is not enough for continued growth.

What's more, the great distance between the lines of the Bollinger Bands indicator suggests that sideways trading is a more likely scenario in the upcoming days. To sum up, traders may expect Bitcoin (BTC) to land in the zone of $9,100-$9,200 soon.
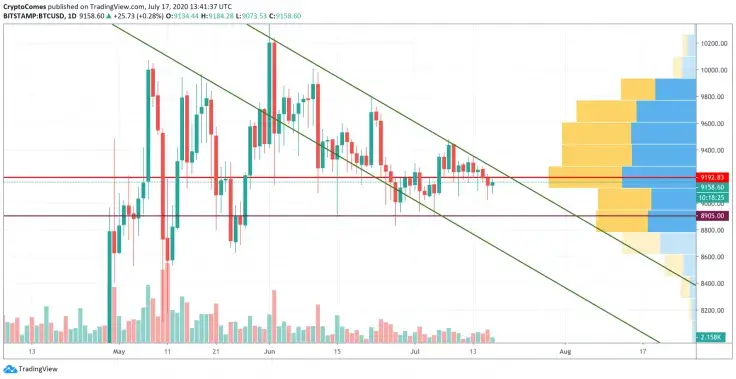
On the daily time frame, a bearish mood still prevails. Bulls cannot break the falling channel, and the trading volume remains at a lower level. For this reason, there is a high probability of seeing the leading crypto at the bottom area of the channel at $8,900 at the beginning of August.
Bitcoin is trading at $9,150 at press time.
 Dan Burgin
 U.Today Editorial Team