Disclaimer: The opinions expressed by our writers are their own and do not represent the views of U.Today. The financial and market information provided on U.Today is intended for informational purposes only. U.Today is not liable for any financial losses incurred while trading cryptocurrencies. Conduct your own research by contacting financial experts before making any investment decisions. We believe that all content is accurate as of the date of publication, but certain offers mentioned may no longer be available.
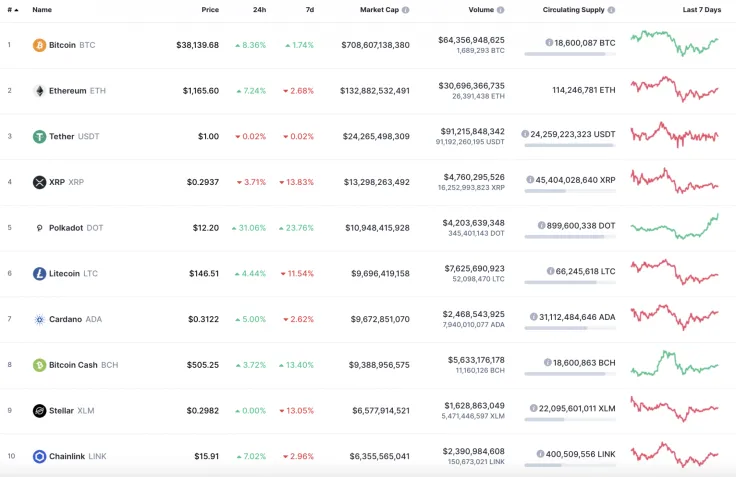
The bullish trend has continued on the cryptocurrency market as most of the coins are in the green zone. XRP is the only loser from the list, with a rate dropping by 3.71%.
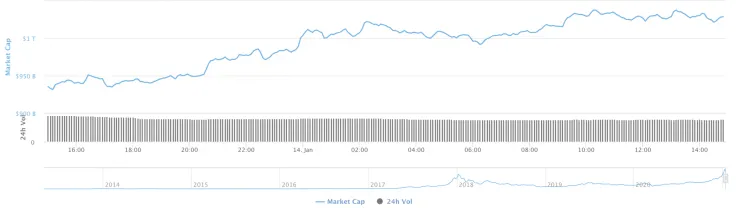
The cryptocurrency capitalization index has come back to the $1 trillion mark.
The relevant data for Bitcoin today:
-
Name: Bitcoin
Advertisement -
Ticker: BTC
-
Market Cap: $711,171,962,549
-
Price: $38,396.60
Advertisement -
Volume (24h): $64,533,780,389
-
Change (24h): 11.25%
The data is relevant at press time.
BTC/USD: Is the current bounce off a prerequisite for new peaks?
Yesterday morning, buyers retraced the Bitcoin (BTC) price to the hourly EMA55 area, and this moving average kept the pair's recovery in a narrow sideways range until evening.

At the end of the day, bulls managed to break through the resistance of the average price level and continue to rise above the level of $36,000.
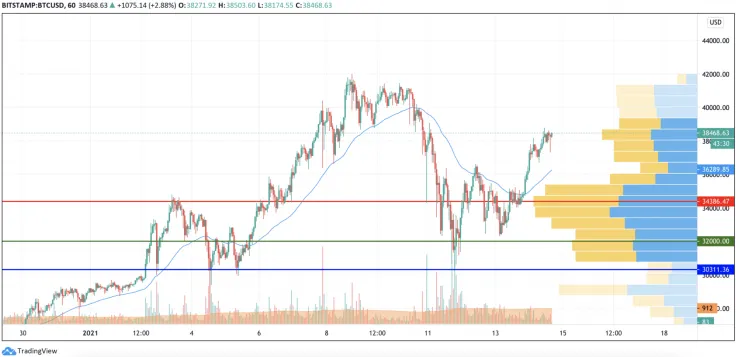
Buyers achieved a retest of the $38,000 resistance tonight, which halted the dynamic recovery of the pair. In the morning, a slight pullback to the $36,000 area is expected but, if this level acts as a support, bulls will be able to continue recovering to the resistance area of $40,000.
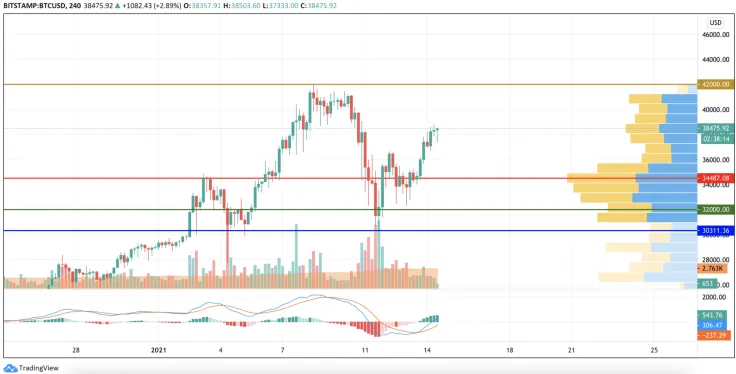
On the bigger chart, Bitcoin (BTC) is about to target the peak of $42,000 by the end of the week. Bulls' efforts are confirmed by the buying trading volume as well as the MACD indicator, which is in the green zone.
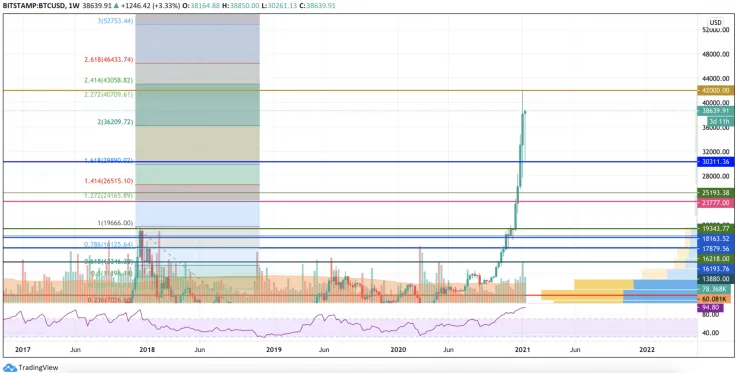
From the technical point of view, the current week may be the last bullish one before a more profound decline. According to the Fibonacci retracement, growth may continue up to the 261.8% level, or around $46,000. After that, there is a high probability of seeing a sharp decline as the RSI indicator is already in the overbought zone.
Bitcoin is trading at $38,691 at press time.
 Dan Burgin
 U.Today Editorial Team