
Disclaimer: The opinions expressed by our writers are their own and do not represent the views of U.Today. The financial and market information provided on U.Today is intended for informational purposes only. U.Today is not liable for any financial losses incurred while trading cryptocurrencies. Conduct your own research by contacting financial experts before making any investment decisions. We believe that all content is accurate as of the date of publication, but certain offers mentioned may no longer be available.
Bitcoin has been trading sideways for the past few weeks, and some investors are becoming increasingly impatient waiting for a new bullish cycle. However, according to some analysts, Bitcoin's current price action could be forming a fractal that might fuel a move similar to what we saw in 2015, when BTC was trading below the $500 mark.
The prolonged consolidation that we are seeing now might become the foundation for a massive price increase in the future. Even after Bitcoin's rally in 2017, the cryptocurrency entered a consolidation channel for around a year. This consolidation was eventually followed by a massive rally that propelled Bitcoin to its all-time high of nearly $20,000 at that time.
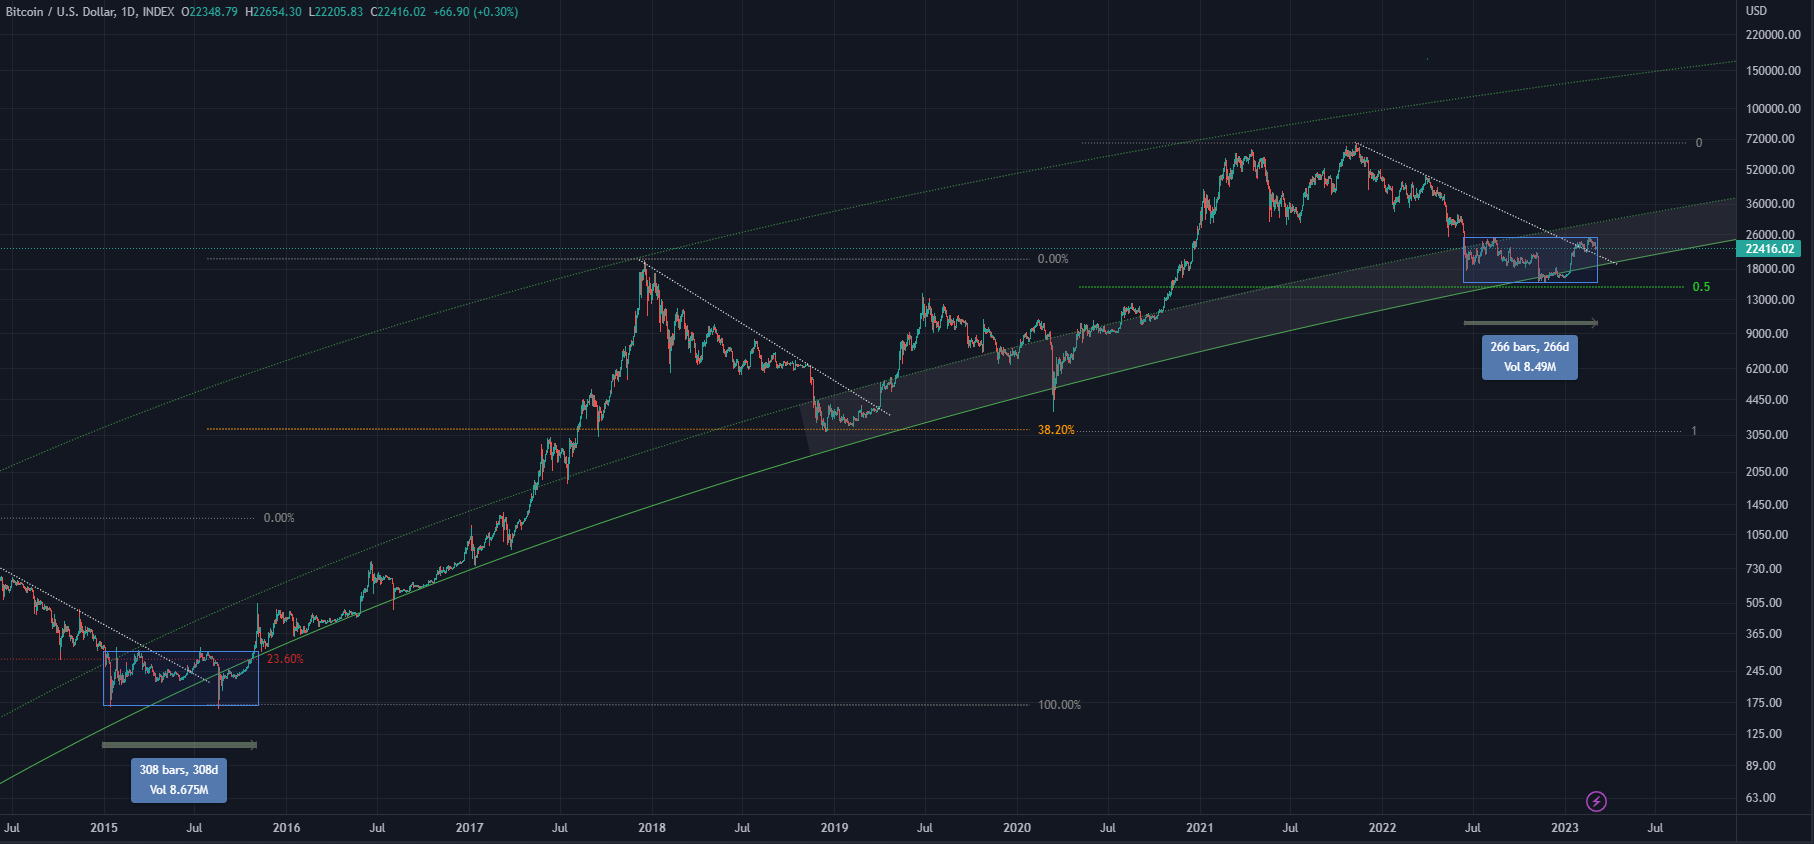
The fractal that analysts are observing on the chart shows Bitcoin's price action following a similar pattern to what we saw in 2015. If this fractal continues to play out, we could see Bitcoin's price move toward the $70,000 threshold.
It is important to note that technical analysis is not an exact science, and fractals are not a foolproof way to predict price movements. However, it is always interesting to see patterns emerge on the chart that could indicate a potential trend.

When analyzing the Bitcoin chart, there are two types of charts that traders usually use: regular and logarithmic charts. Regular or linear charts are the most common type of chart, and they show the price movement of an asset over time on a linear scale.
Logarithmic charts, on the other hand, use a logarithmic scale to show price movements. This means that each point on the chart represents a percentage change in price, rather than an equal change in price.
 Dan Burgin
 U.Today Editorial Team