Disclaimer: The opinions expressed by our writers are their own and do not represent the views of U.Today. The financial and market information provided on U.Today is intended for informational purposes only. U.Today is not liable for any financial losses incurred while trading cryptocurrencies. Conduct your own research by contacting financial experts before making any investment decisions. We believe that all content is accurate as of the date of publication, but certain offers mentioned may no longer be available.
More than 17 trillion Shiba Inu tokens were moved in the last seven days, while Shiba Inu has been showing some notable increase in volatility. With the on-chain activity surging, we might expect some kind of bullish movement in the upcoming week, but it is not guaranteed.
Recently, Shiba Inu has seen an increase in transactions. It is well known for its active community and meme coin status. A staggering 17 trillion SHIB tokens have changed hands in the last week, exciting and confusing traders and analysts. There are a few possible reasons for this activity surge.
Such activity is frequently sparked by conjecture regarding potential new alliances and listings on significant exchanges.
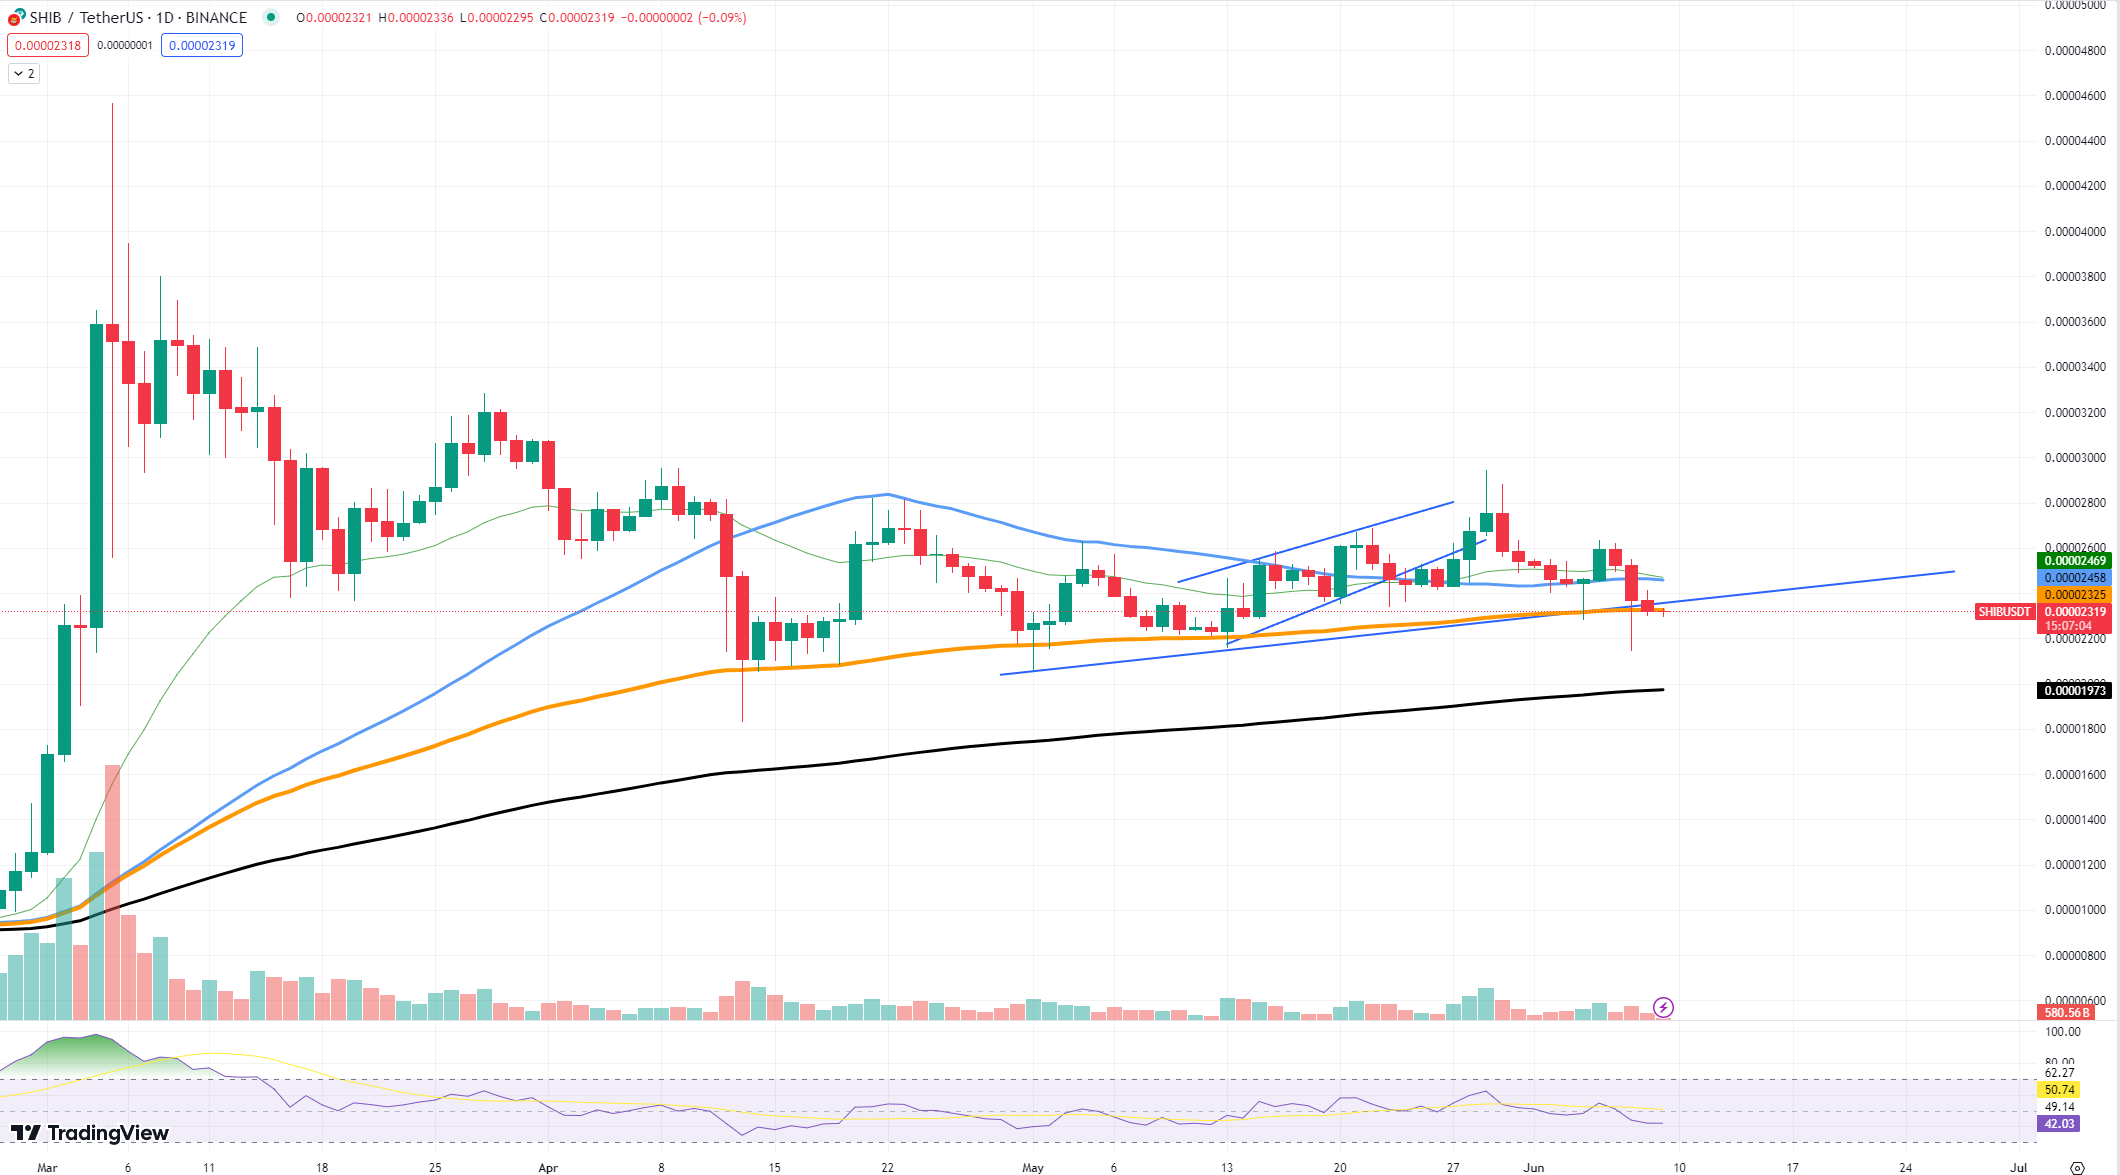
Announcements and rumors have a big impact on how the market behaves and when investors position themselves for possible price movements trading volumes rise. Shiba Inu's price has experienced significant volatility according to chart analysis. Testing of the support and resistance levels on a regular basis suggests a consolidation phase. This behavior indicates that SHIB may be about to make a significant decision at this pivotal point.

We may see a notable upward or downward trend if the price breaks out of the current range. Another important set of indicators to keep an eye on are the moving averages (MAs). While the 200-day MA offers long-term trend direction, the 50-day MA has served as a level of support. SHIB is now in close proximity to these important levels.
If the 200-day MA is still below the price, it may be a sign of bullish sentiment, but if it falls, it may hint at more declines in the foreseeable future. An intriguing picture is also painted by the data on big transactions.
The volume and number of large transactions increased sharply, peaking on June 5 at 161 trillion SHIB and 731 transactions. According to this, major players may be positioning themselves for an upcoming volatility increase.
 Dan Burgin
 U.Today Editorial Team