Disclaimer: The opinions expressed by our writers are their own and do not represent the views of U.Today. The financial and market information provided on U.Today is intended for informational purposes only. U.Today is not liable for any financial losses incurred while trading cryptocurrencies. Conduct your own research by contacting financial experts before making any investment decisions. We believe that all content is accurate as of the date of publication, but certain offers mentioned may no longer be available.
Bulls are realizing their potential accumulated over a long period of time. At the moment, most of the top 10 coins are in the green zone except for Cardano (ADA) and Binance Coin (BNB), whose rates have declined by 0.91% and 1.65% respectively.
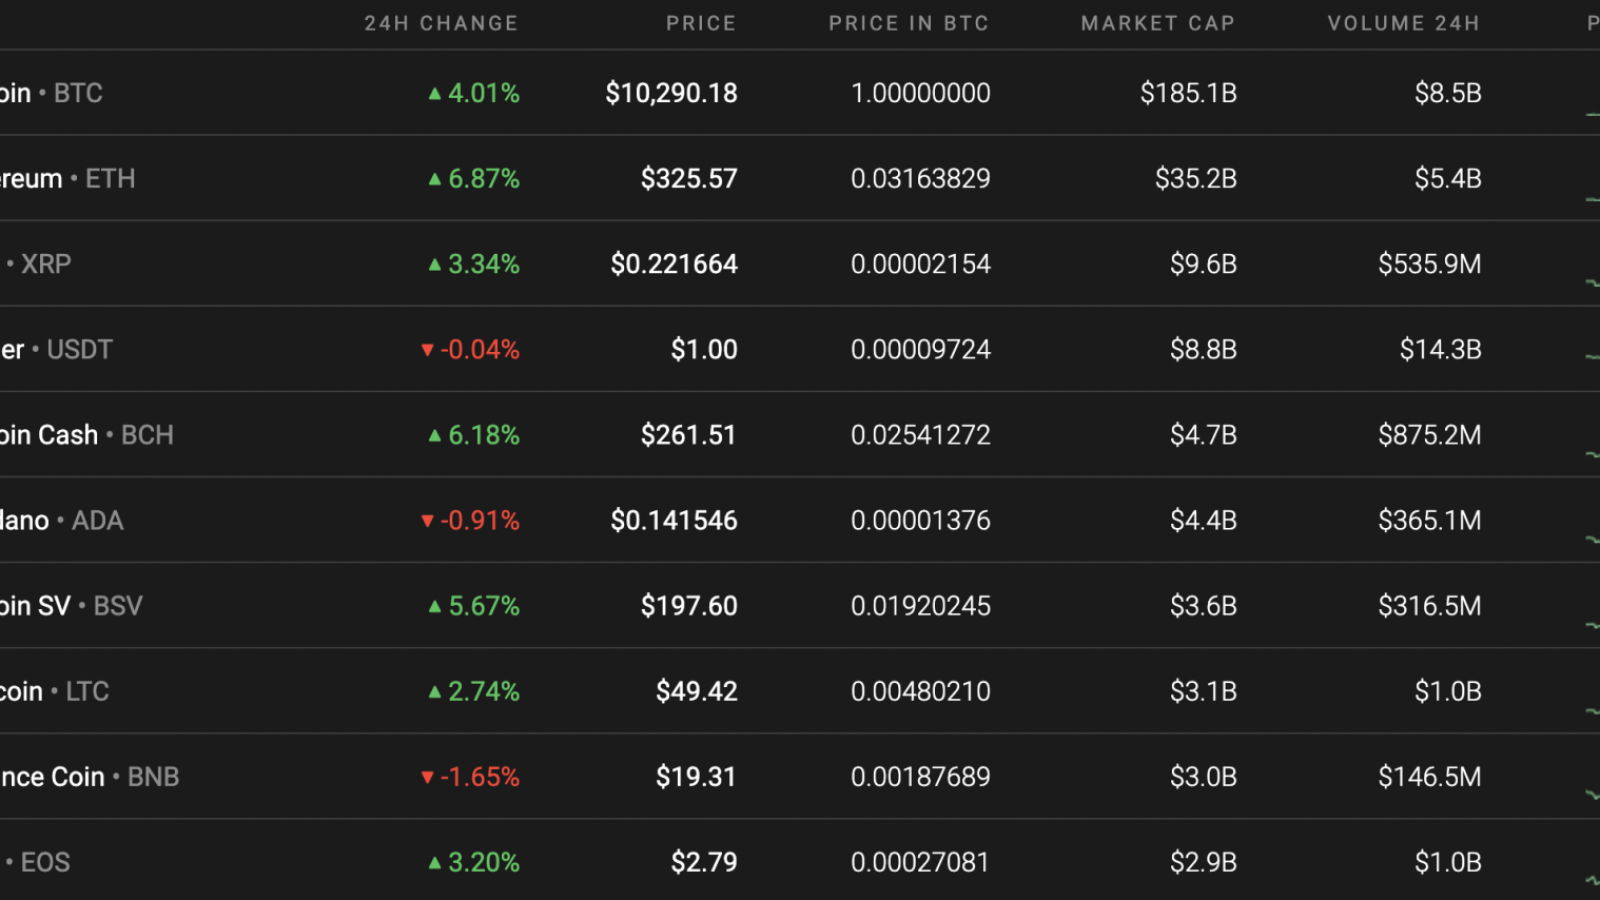
Against the sharp rise of mostly Bitcoin (BTC) and some other popular altcoins like Ethereum (ETH), the total cryptocurrency market capitalization has increased by almost $10 bln over the last day.
The relevant XRP data stacks up like this:
-
Name: XRP
-
Ticker: XRP
-
Market Cap: $9,914,015,495
-
Price: $0.221054
-
Volume (24h): $1,264,735,489
-
Change (24h): 3.06%
The data is relevant at press time.
XRP/USD: Can bulls quickly reach $0.25 before a correction starts?
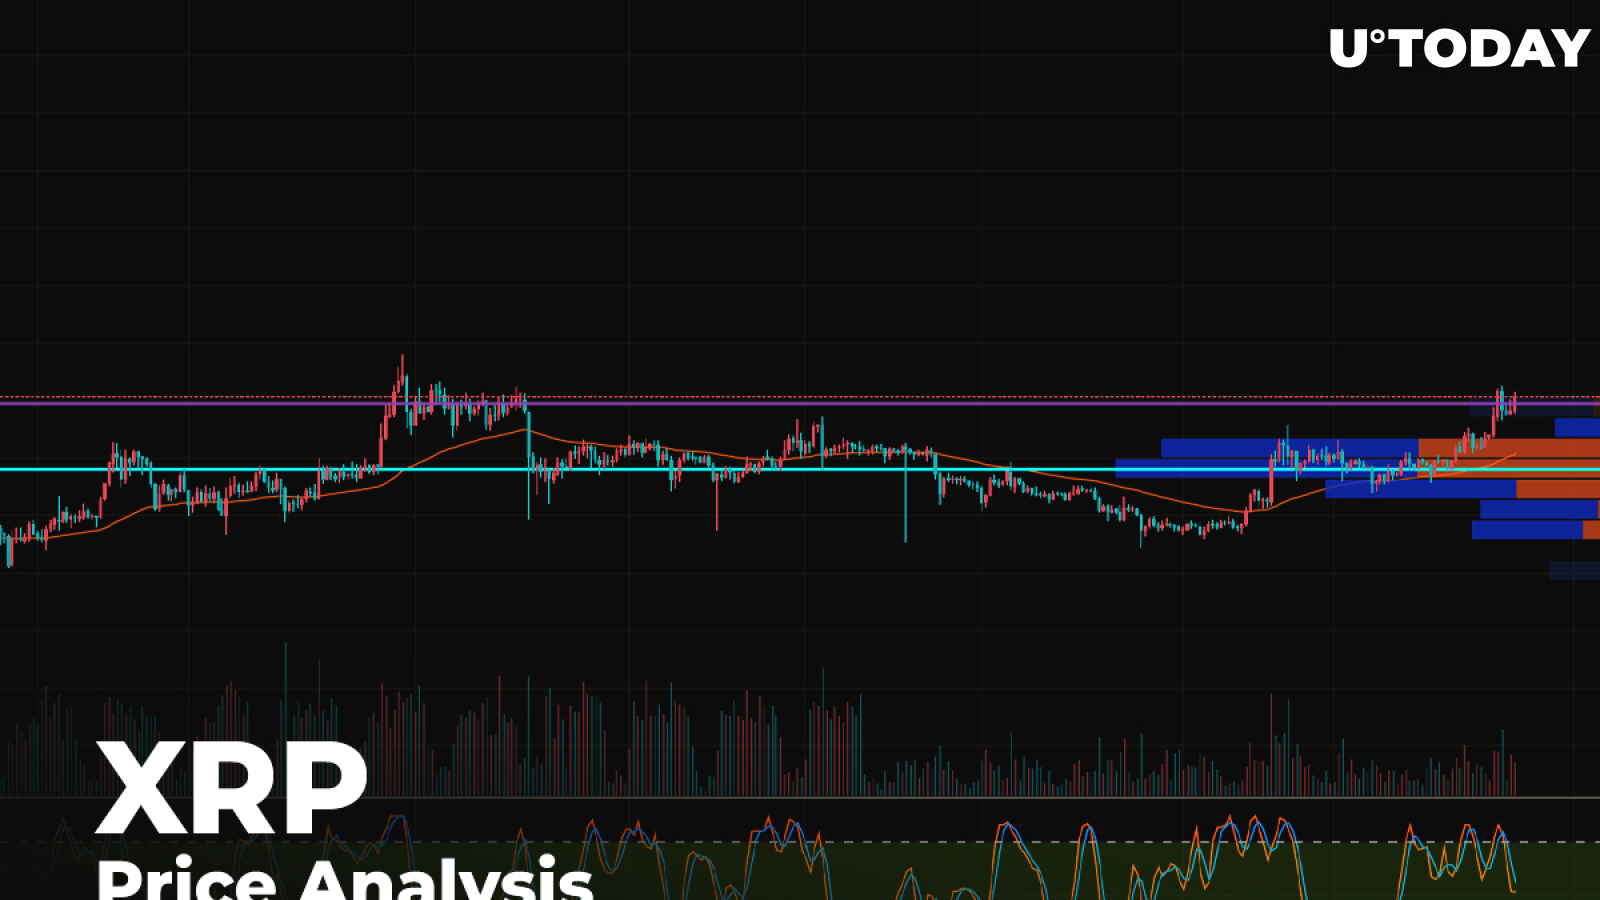
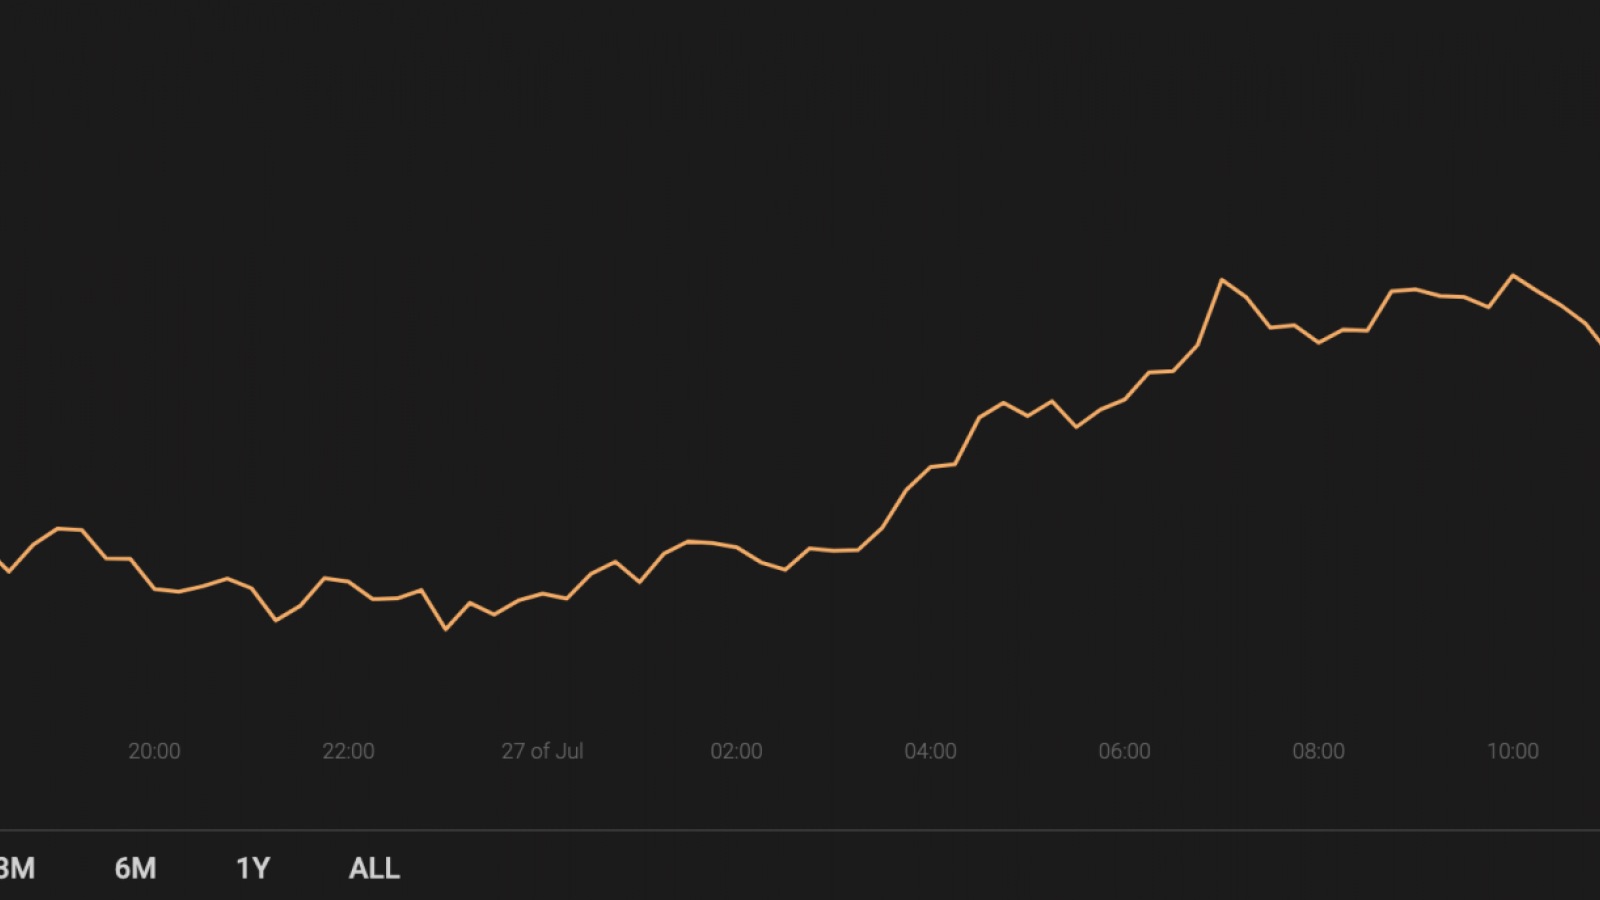
On Saturday, the XRP price broke through the $0.213 resistance and renewed the monthly high at the $0.218 point. On Sunday, bulls continued their growth and the next July maximum was set at $0.225.
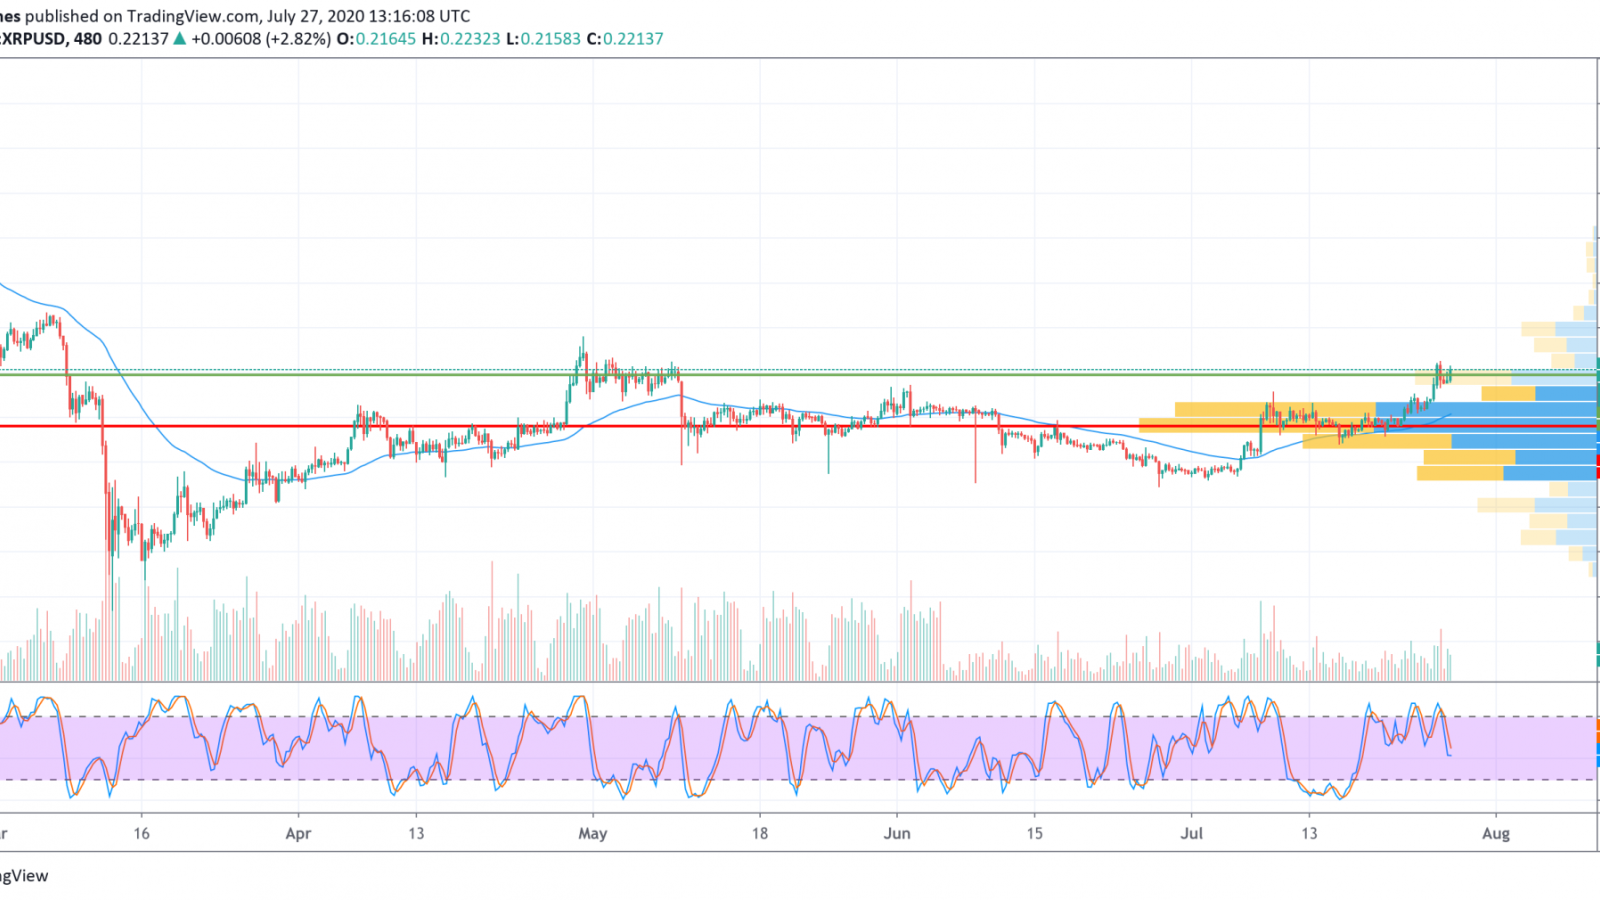
Growth is possible today to the resistance zone of $0.230. The April maximum was recorded a little above this level at $0.236. Due to the strong overheating of the market, the XRP/USD pair may soon roll back to the support of $0.213.
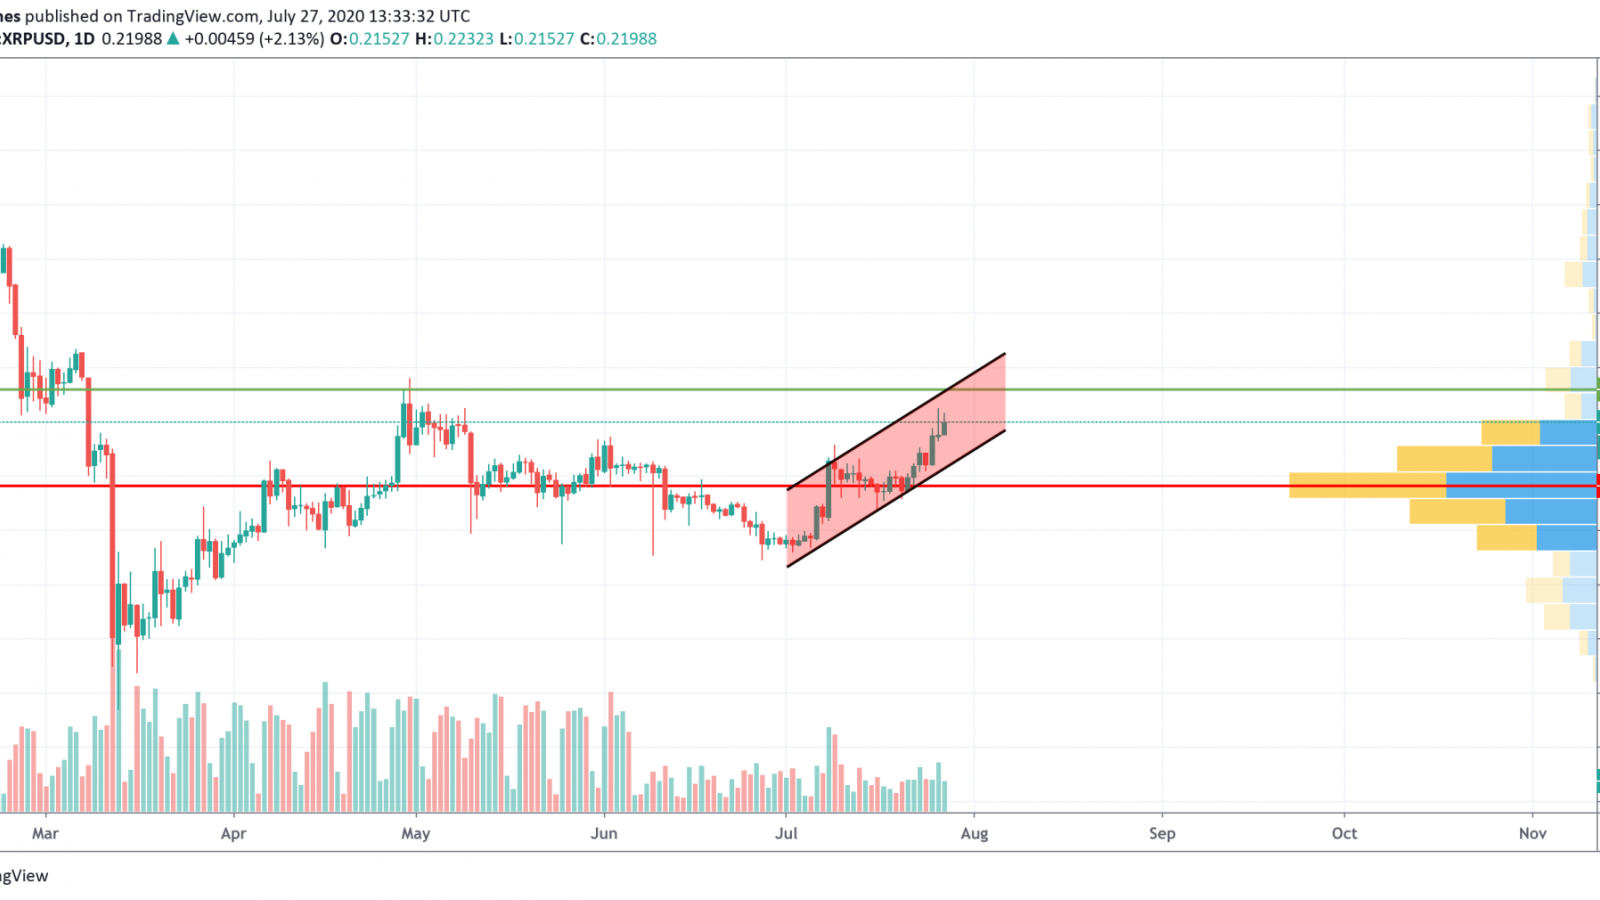
On the daily time frame, XRP keeps growing against a relatively high trading volume. However, the rise is slowing down as there is almost no buyers' interest in the area around $0.23 based on the liquidity level. This is why a decline prevails over continued growth in the long-term perspective. In this case, the top of the rising channel at $0.2317 might be the endpoint of the growth, followed by a correction.
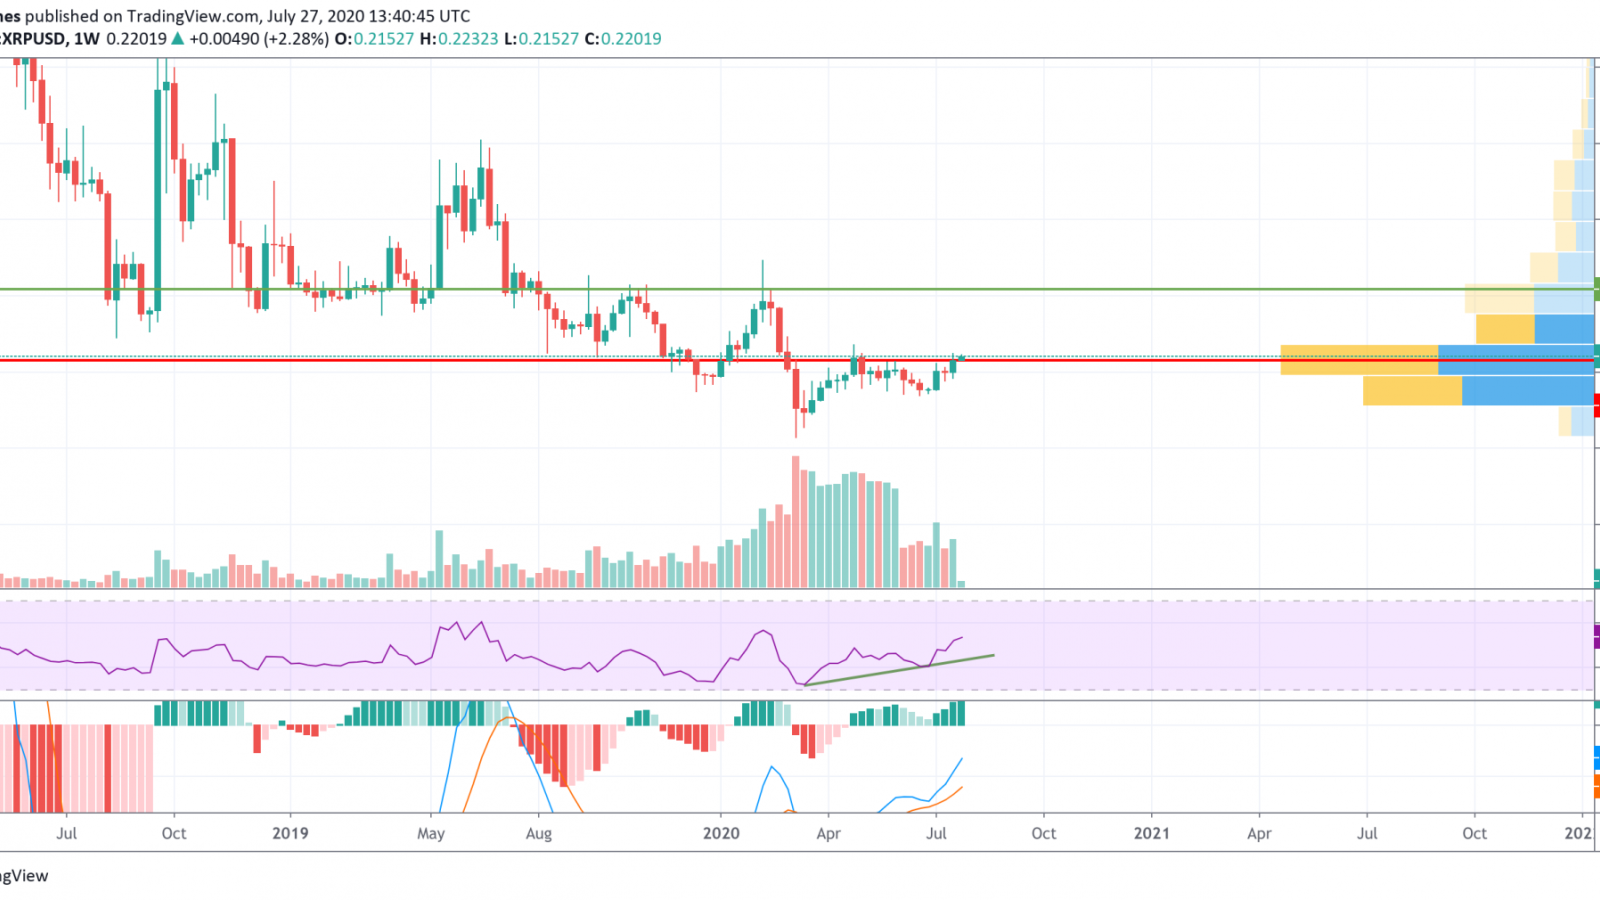
On the weekly time frame, the situation is much better as the lines of the MACD indicator are going up, confirming the presence of buyers. The bullish divergence on RSI considers the ongoing rise of XRP by the end of summer to the beginning of fall 2020. The first obstacle at which the bears may show resistance is the $0.3091 mark. This is a long-term perspective, likely to be seen closer to the end of the current year.
XRP is trading at $0.2208 at press time.