Disclaimer: The opinions expressed by our writers are their own and do not represent the views of U.Today. The financial and market information provided on U.Today is intended for informational purposes only. U.Today is not liable for any financial losses incurred while trading cryptocurrencies. Conduct your own research by contacting financial experts before making any investment decisions. We believe that all content is accurate as of the date of publication, but certain offers mentioned may no longer be available.
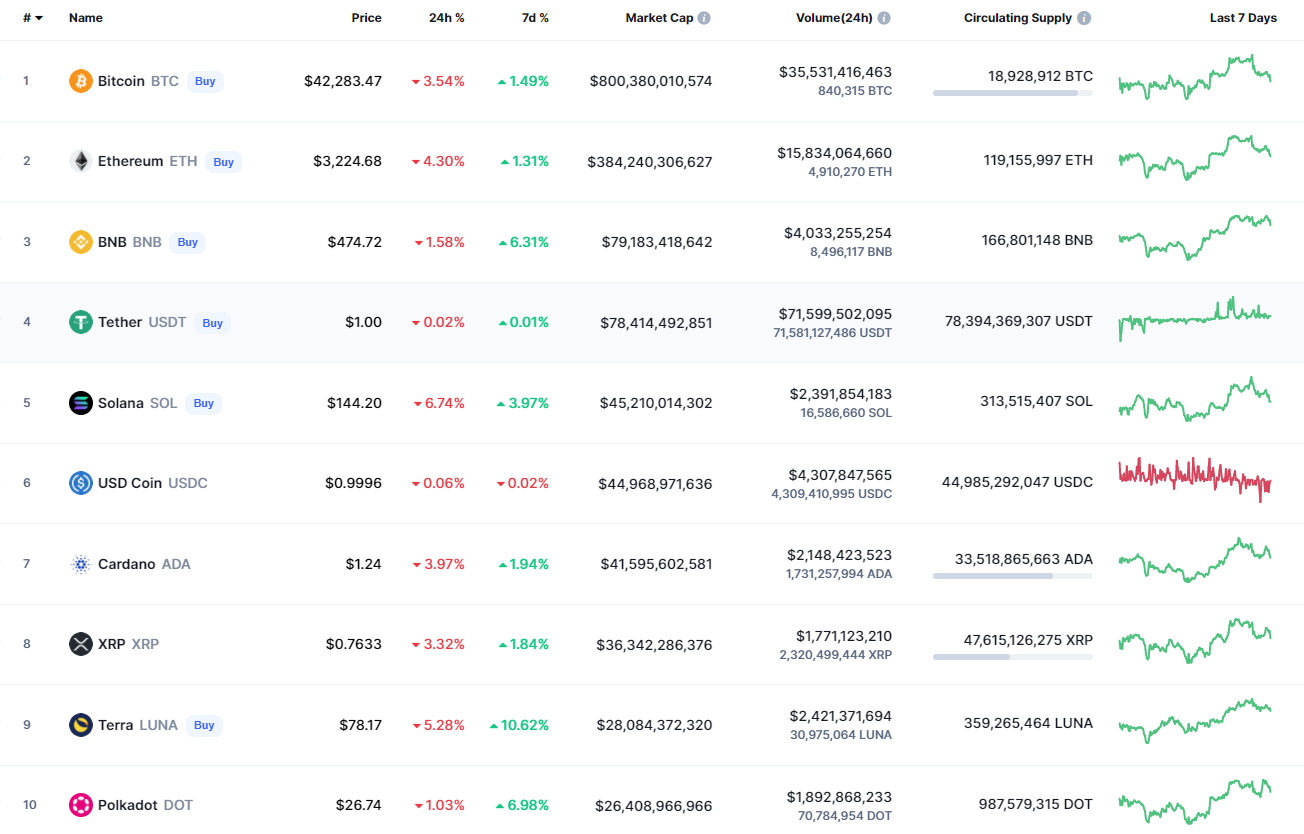
Buyers could not maintain bullish momentum, and the majority of coins are under bearish pressure once again.
AVAX/USD
Avalanche (AVAX) is the biggest loser from the list today, dipping more than 7%.
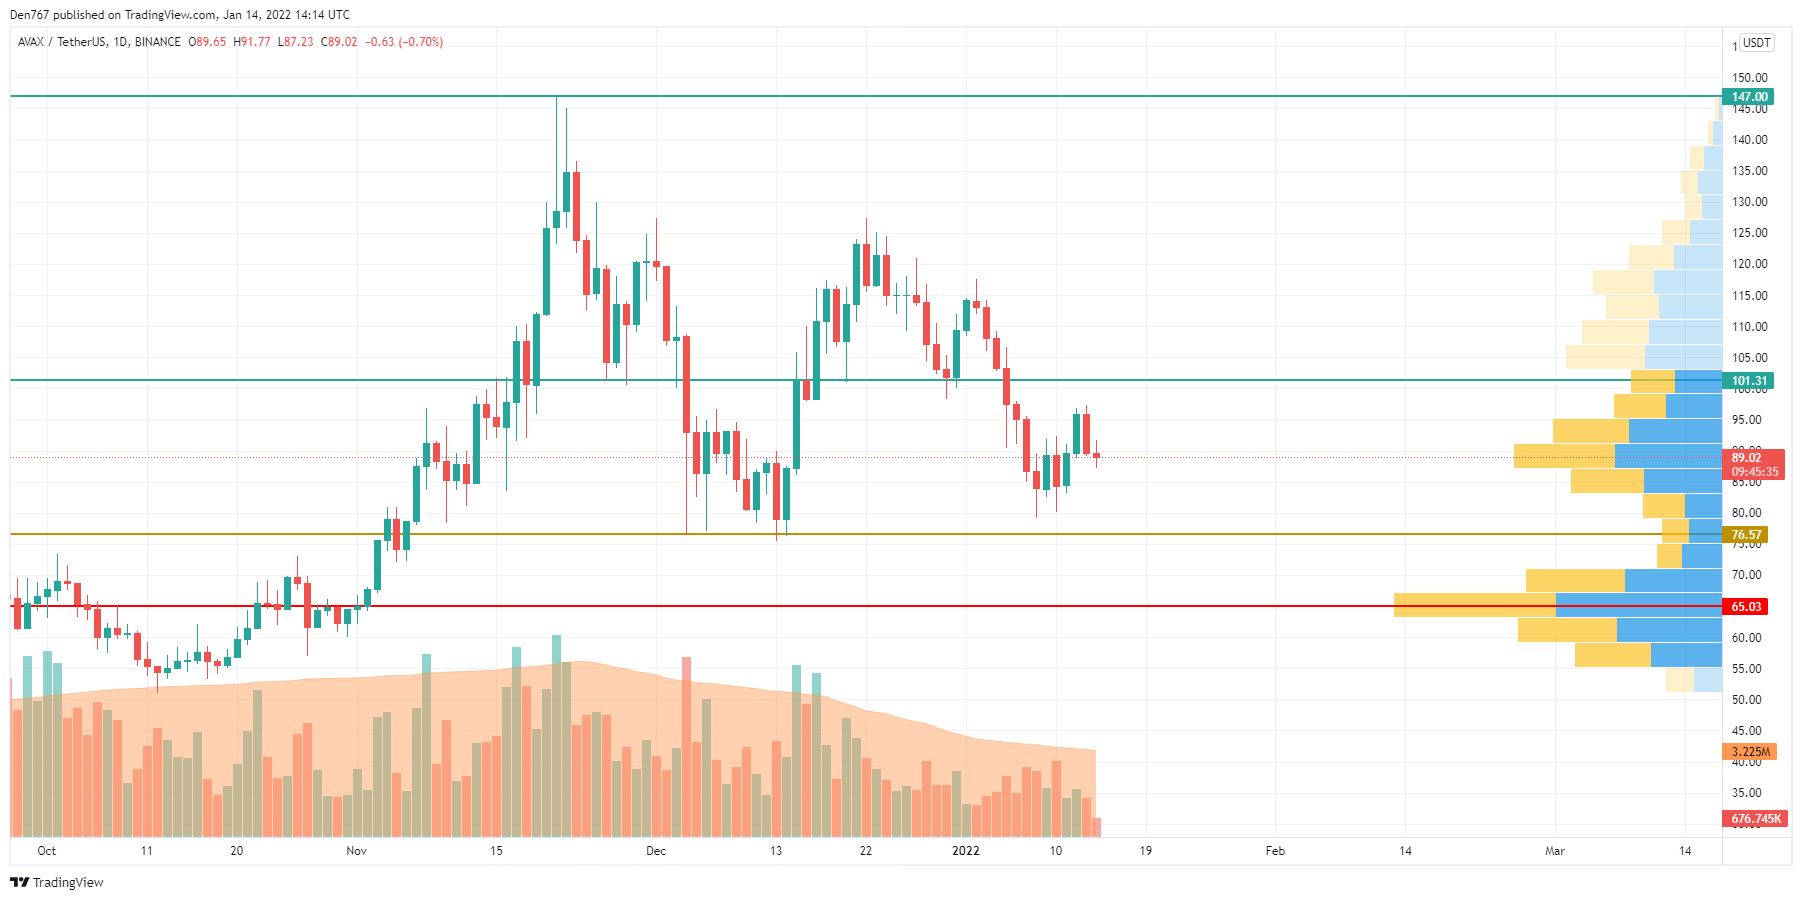
Despite the fall, the altcoin keeps trading within the big channel between the support level at $76.57 and the resistance level at $101. The sideways trading is also confirmed by the decreasing trading volume, which means that neither bulls nor bears are dominating at the moment.
In this case, there's a low chance of seeing a sharp movement shortly as the coin needs to accumulate more power.
AVAX is trading at $88.85 at press time.
DOT/USD
Polkadot (DOT) is performing better compared to the other coins from the pack, dropping by only 1.93%.
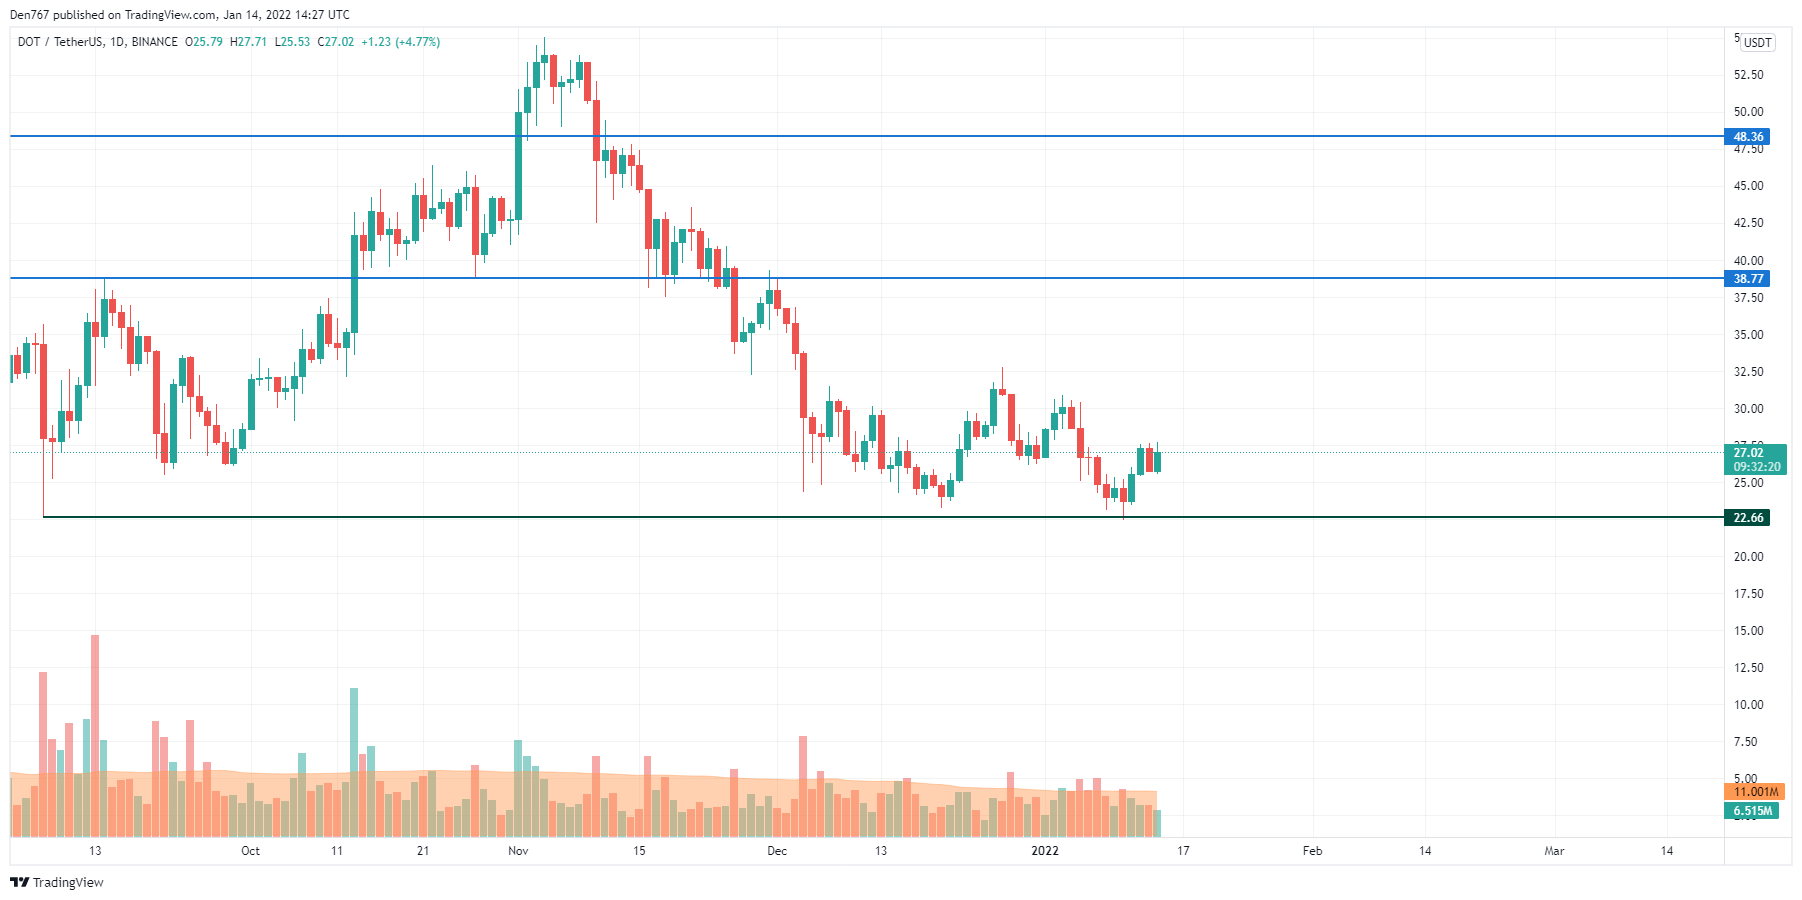
After Polakdot (DOT) made a false breakout of the support level at $22.66, it is trying to accumulate energy to come back to restore the lost positions. If the buying trading volume increases, DOT might return to the vital zone around $30.
However, the mid-term bullish trend can start again only if the daily candle fixes above the resistance at $38.77.
DOT is trading at $26.99 at press time.
LINK/USD
LINK is not an exception, going down by 7.63%.
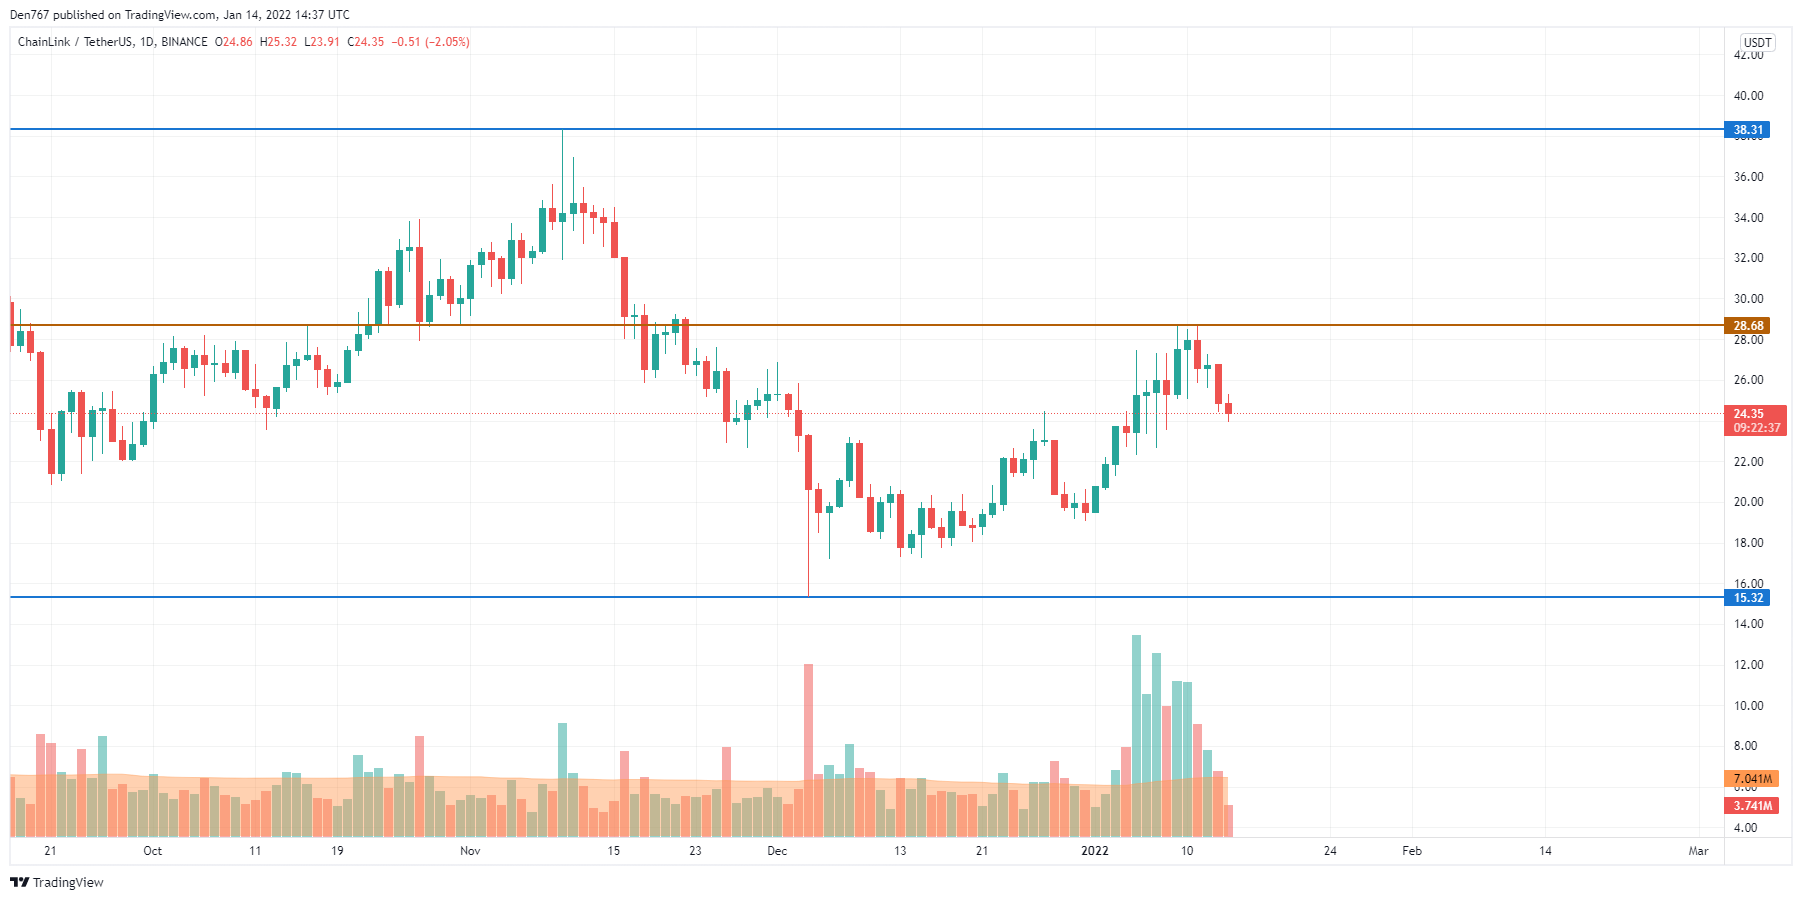
Chainlink (LINK) is trading sideways despite today's fall. At the moment, the price is located closer to the resistance against the increased trading volume. If the pice comes back to the orange line at $26.68 and breaks it, buyers may keep the growth to another level at $38.
LINK is trading at $24.35 at press time.