Disclaimer: The opinions expressed by our writers are their own and do not represent the views of U.Today. The financial and market information provided on U.Today is intended for informational purposes only. U.Today is not liable for any financial losses incurred while trading cryptocurrencies. Conduct your own research by contacting financial experts before making any investment decisions. We believe that all content is accurate as of the date of publication, but certain offers mentioned may no longer be available.
The cryptocurrency market is a roller coaster, and XRP is no exception. However, recent price analysis shows some promising signs for XRP holders. As of Aug. 24, 2023, XRP is trading at $0.5282, and its weekly chart reveals some interesting patterns.
One of the most bullish indicators in technical analysis is the golden cross, and XRP's weekly chart has recently displayed this pattern. A golden cross occurs when a short-term moving average crosses above a long-term moving average, signaling a potential reversal from a bearish to a bullish trend. This could be a strong indicator that XRP is gearing up for significant upward movement.
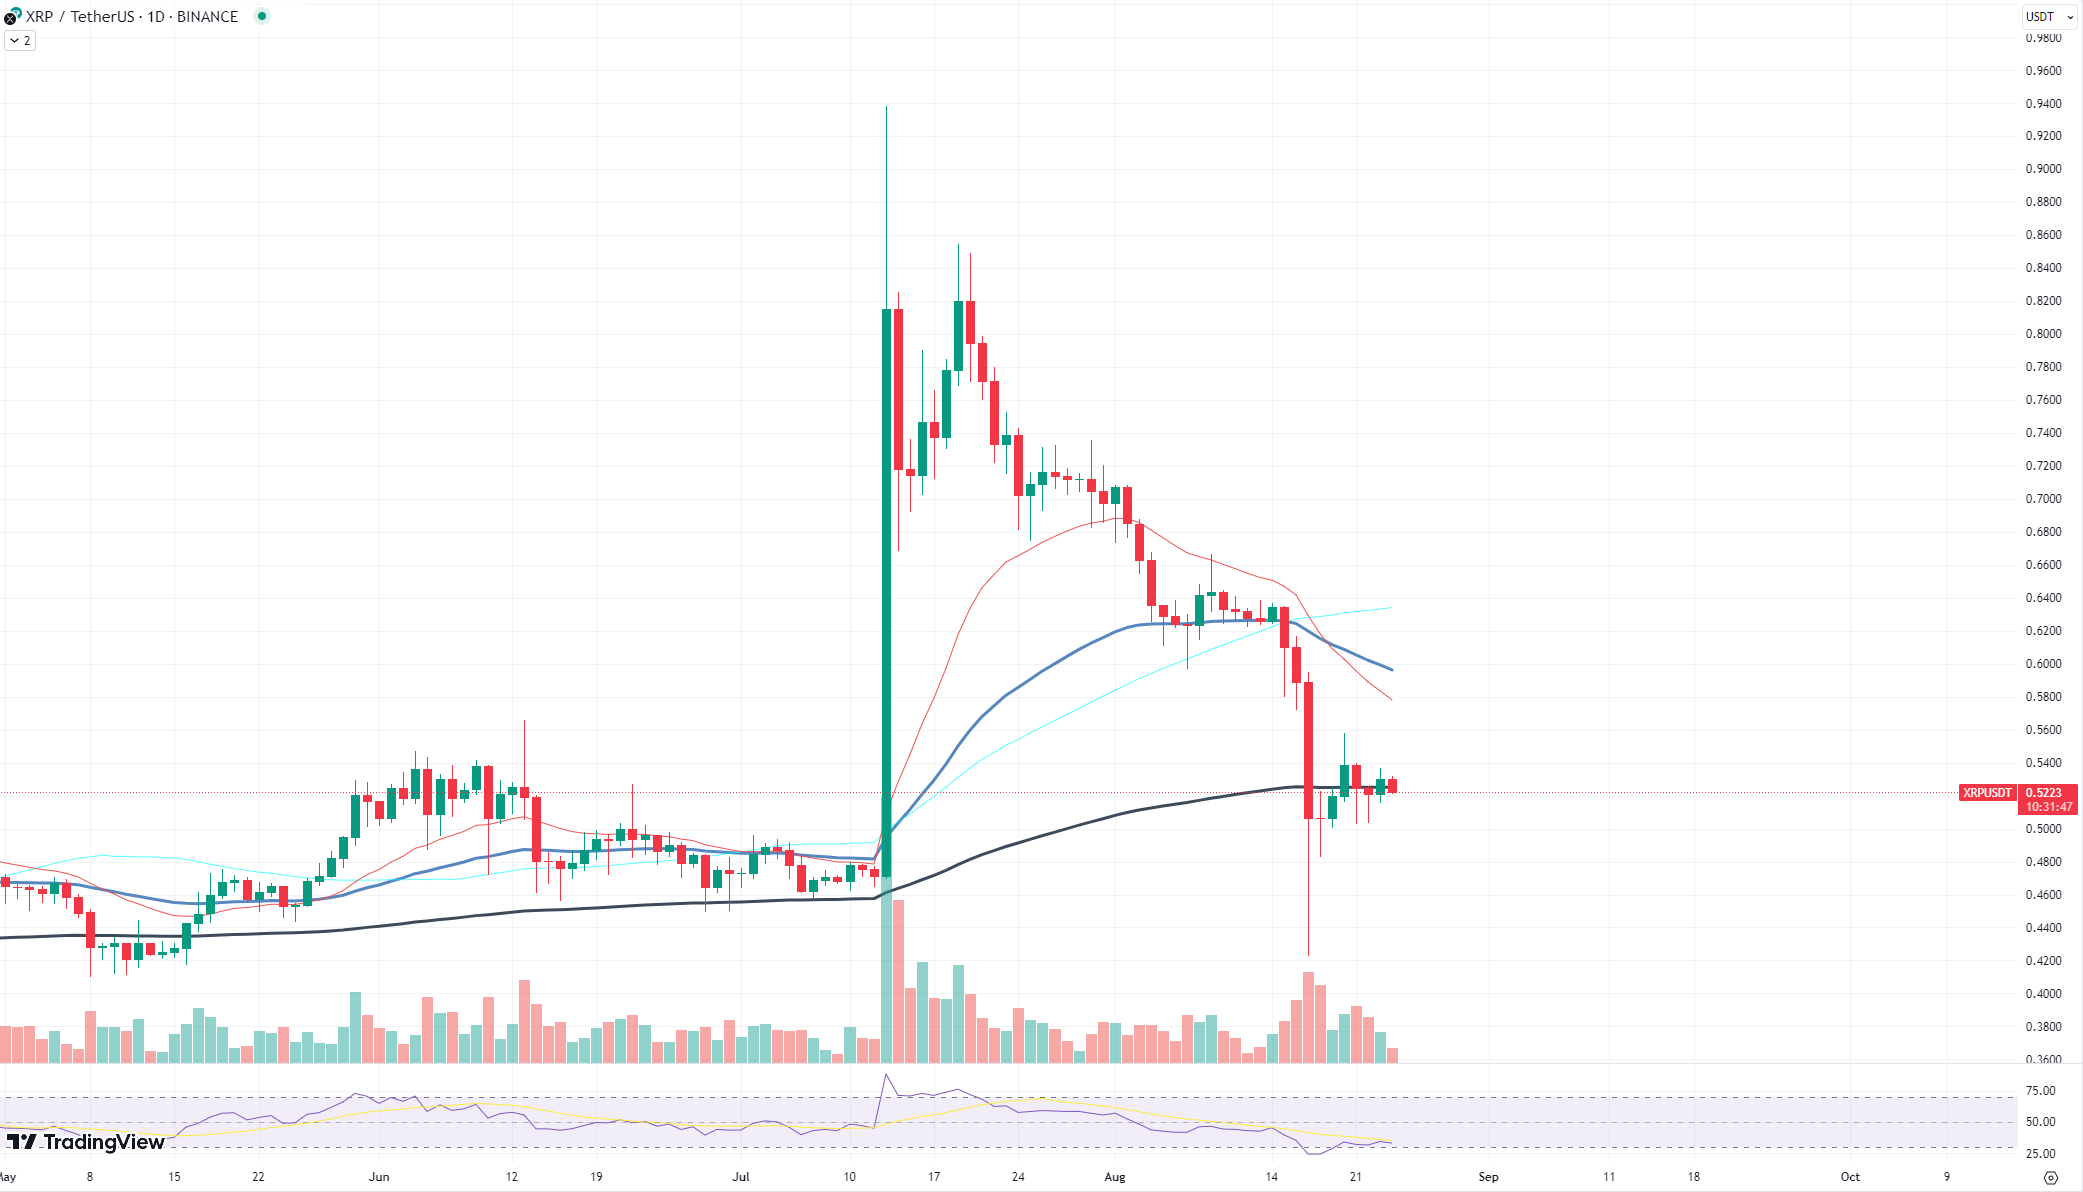
Another promising sign is that XRP has returned to a key support level on both its daily and weekly charts. This support level has been able to withstand selling pressure, which is a positive sign. If this support level continues to hold, it could serve as a strong foundation for a fuller price reversal in the near future.
The fact that the support level is holding up against selling pressure could also indicate that we are in an accumulation phase. During this phase, smart money often enters the market, buying up assets at lower prices before a potential breakout.
It is also worth noting that XRP has some significant events on the horizon, including the upcoming appeal of the SEC. A positive outcome in these cases could serve as a strong catalyst for upward price movement.
ADA meets RSI divergence
Divergences between price and indicators often serve as powerful signals for future price action. Cardano (ADA) is currently displaying such a divergence, specifically between its Relative Strength Index (RSI) and its price trend. This divergence is particularly interesting because it is tied to a key resistance level.
In Cardano's case, the RSI is showing an ascending trend, suggesting increasing momentum. However, the price of ADA is on a descending trend, creating what is known as a "bullish divergence."
This divergence is occurring near a significant resistance level for ADA. Resistance levels act as a ceiling for the price, making it difficult for the asset to break through. Divergence at this level could indicate that the bears are losing steam and a bullish reversal might be on the horizon.
When RSI and price diverge in this manner, it often signals a potential change in trend. Given that the divergence is bullish and is occurring at a resistance level, there is a strong possibility that ADA could break through this resistance in the near future. If it does, it could trigger a new upward trend, rewarding those who took the divergence as a bullish sign.
Solana defies death
Despite the ominous death cross formation on its chart, Solana (SOL) has defied expectations by breaking through and gaining solid market support. As of the most recent data, Solana is trading at approximately $21.69, showing resilience on a market that has been anything but predictable.
In the short term, Solana's price action is encouraging. The death cross, a bearish indicator, did not seem to have the expected negative impact on the asset. Instead, Solana managed to maintain its price level and even show signs of upward movement.

In the midterm, Solana's performance will likely depend on how well it can sustain this newfound momentum. If the asset can consolidate above the current price level, it could set the stage for further gains. The next target could be the $25-$30 range, which would signify a significant bullish reversal.
While the death cross is generally a bearish sign, it is essential to remember that no single indicator should be used in isolation. Solana's strong fundamentals and growing ecosystem could very well outweigh the bearish signals on the chart. Investors should keep an eye on volume and other technical indicators to gauge whether Solana can maintain its current trajectory.
 Dan Burgin
 U.Today Editorial Team