Disclaimer: The opinions expressed by our writers are their own and do not represent the views of U.Today. The financial and market information provided on U.Today is intended for informational purposes only. U.Today is not liable for any financial losses incurred while trading cryptocurrencies. Conduct your own research by contacting financial experts before making any investment decisions. We believe that all content is accurate as of the date of publication, but certain offers mentioned may no longer be available.
It has been a grueling month for XRP investors as the cryptocurrency continues to grapple with a prolonged downturn. The asset has been stuck in a relentless downtrend for over 25 days now, marking a stark contrast to the victorious stride it had against the Securities and Exchange Commission (SEC).
Despite having triumphed over such a formidable entity, XRP is having a hard time maintaining its upward trajectory. The loss of value has been drastic, with more than half of its rally now erased. The current price is at a dismal $0.6, instigating anxiety and concern among investors.
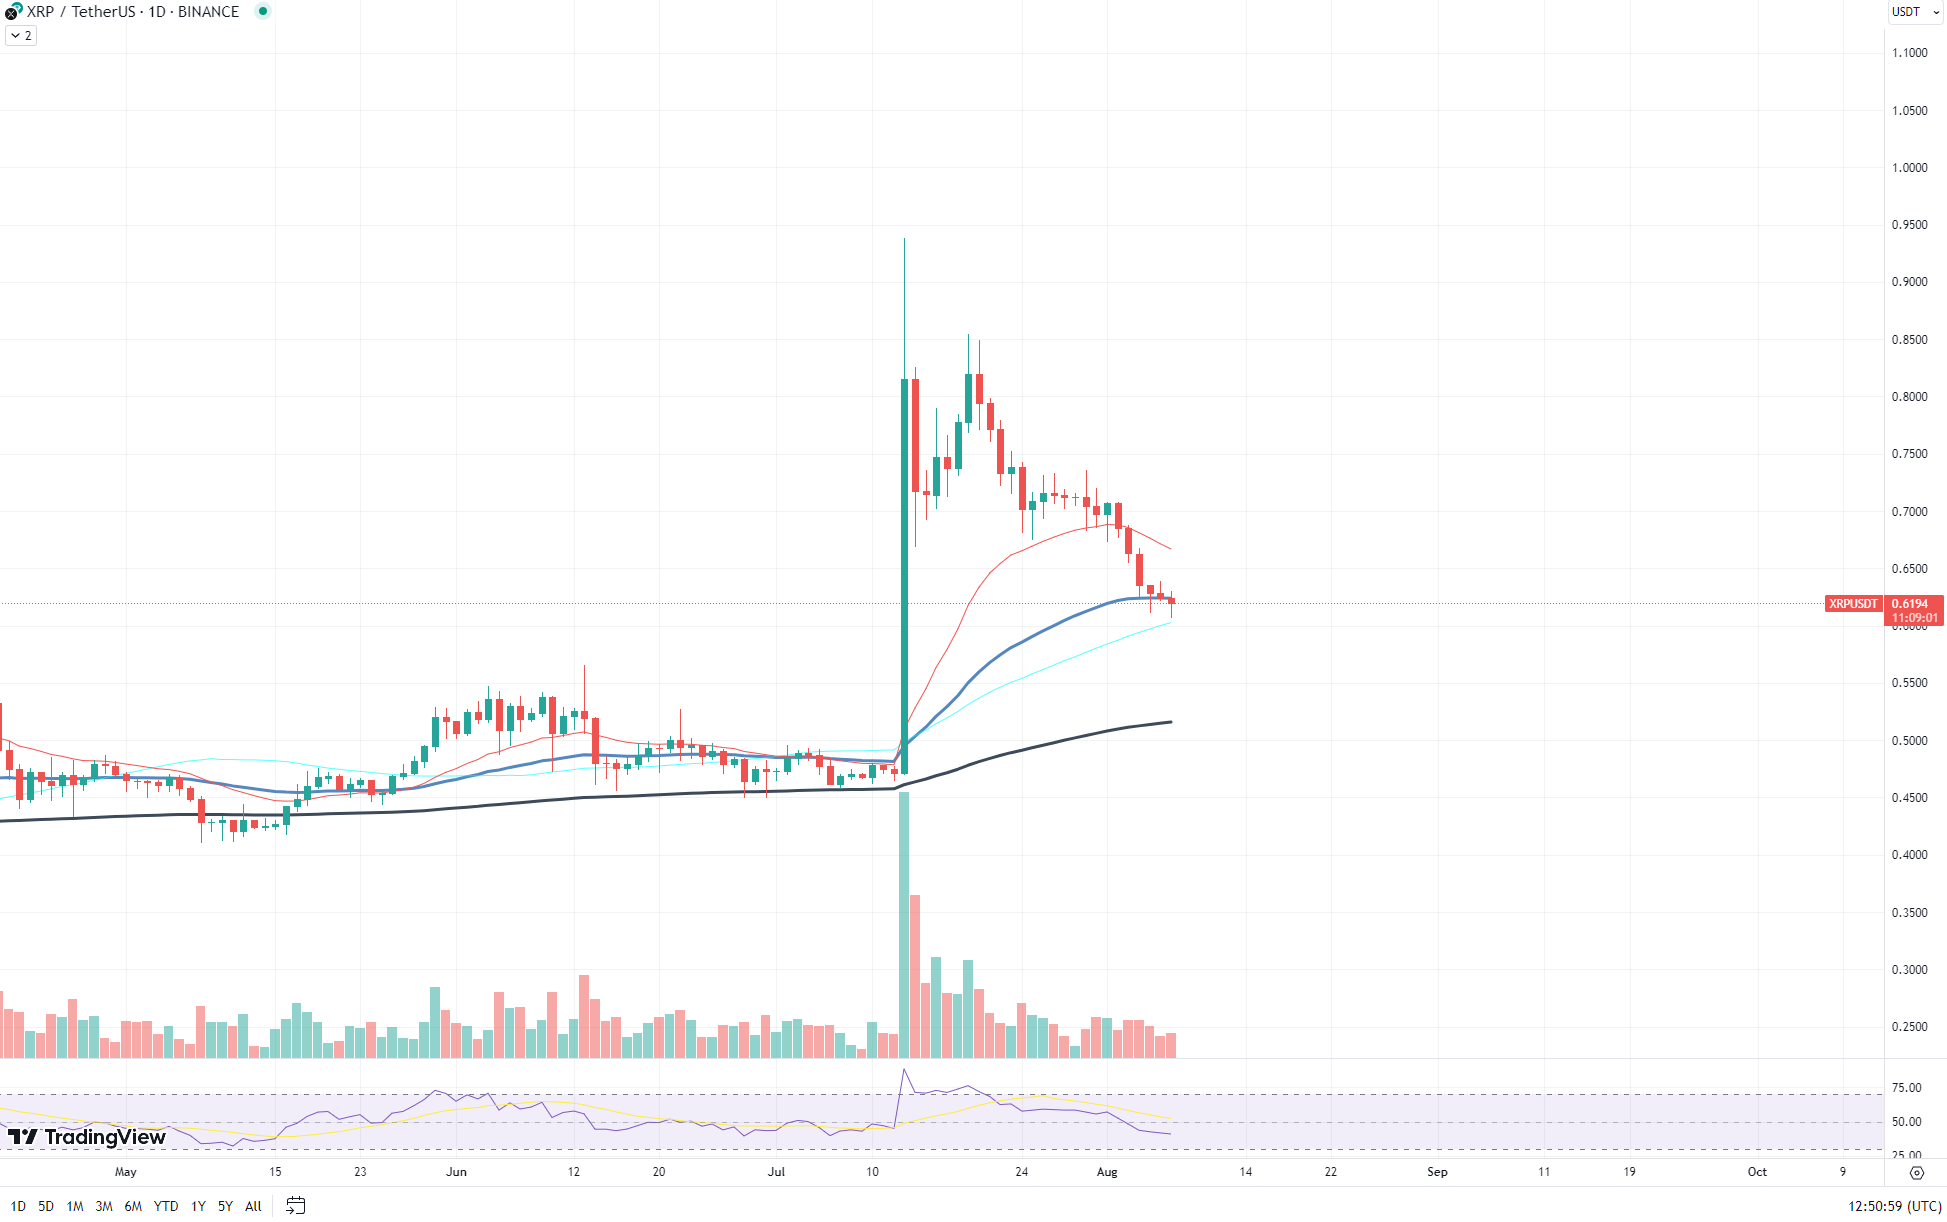
One promising sign is the fading trading volume, often a precursor to a possible price reversal or consolidation. Decreasing volume during a downward trend can suggest that the bearish momentum is dwindling, potentially paving the way for bulls to reclaim the market.
Despite the 50 Exponential Moving Average (EMA) breaking, the 50-day Moving Average (MA) is still intact, providing a semblance of support. Nevertheless, the market needs a stronger driver to overturn the current bearish sentiment.
With over 50% of its rally already wiped out, the immediate future of XRP seems uncertain. However, the ebbing volume and resilient 50-day MA provide a glimmer of hope for a potential market reversal or consolidation.
Shiba Inu's drawback
In a surprising twist of events, the Shiba Inu (SHIB) rally suffered its first significant drawback, losing 10% of its value as large investors, or "whales," began cashing in on their gains. This outcome is further substantiated by an observed uptick in transaction volume on the market, signaling a wave of profit-taking among prominent holders.
Shiba Inu, after its recent upward trajectory, had successfully broken through the 200 Exponential Moving Average (EMA), a key indicator used by traders to assess price trends and reversals. Such a breakthrough often hints at a strong bullish trend and typically propels further investor confidence.

However, contrary to expectations, Shiba Inu encountered heightened selling pressure following this breakthrough, leading to a considerable price drop and the subsequent invalidation of its bullish momentum. The unexpected downturn suggests that whales took this moment of peak value to secure their profits, thus triggering a downward price spiral.
As of now, Shiba Inu trades at $0.00000915, marking a sharp 10% decline from yesterday's peak at $0.00001. This descent has raised eyebrows among investors, who are now closely monitoring the meme coin to see whether it will demonstrate resilience and initiate a recovery.
Despite the sudden downturn, it is worth noting that the cryptocurrency market is notoriously volatile, and such price fluctuations are commonplace. Moreover, this setback might not necessarily imply a long-term bearish trend for Shiba Inu. Investors and traders should keep a vigilant eye on market indicators and trends, preparing for potential opportunities that the dynamic crypto space invariably offers.
Ethereum shows endurance
The leading altcoin, Ethereum (ETH), has been enduring an extended downtrend for a while, sparking concerns among investors. However, signs of an impending turnaround might be on the horizon as Ethereum's price movement starts to exhibit a "flattening" trend. Currently, Ethereum is trading at $1,814, showing an intriguing sideways motion indicative of a potential impending reversal.
This "flattening" trend refers to declining downward volatility, which suggests the bearish momentum could be losing steam. As the price begins to oscillate within a narrow band, this typically denotes consolidation — a precursor to a possible change in direction.

Adding to this, the volume of Ethereum has been gradually descending, another critical sign of market consolidation. Volume acts as a vital gauge of the strength or weakness of a price movement. A decrease in volume during a downward trend often implies that the trend is nearing its end. This could well be the case with Ethereum, hinting at an upcoming reversal.
While these indicators point to a possible upswing, investors should tread with caution. Cryptocurrency markets are notoriously unpredictable, and while these signs seem promising, other market forces could sway the price in an entirely different direction.
 Dan Burgin
 U.Today Editorial Team