Disclaimer: The opinions expressed by our writers are their own and do not represent the views of U.Today. The financial and market information provided on U.Today is intended for informational purposes only. U.Today is not liable for any financial losses incurred while trading cryptocurrencies. Conduct your own research by contacting financial experts before making any investment decisions. We believe that all content is accurate as of the date of publication, but certain offers mentioned may no longer be available.
XRP has recently displayed several unhealthy chart patterns, raising concerns about the asset's future performance. Here are three key patterns that investors should be aware of.
XRP experienced a sharp price drop to $0.43, which is likely due to a sudden spike in selling pressure from large holders. This unexpected price movement can be an alarming sign for investors, as it indicates potential instability on the market. Such sharp wicks often reflect short-term volatility and can lead to further price fluctuations if selling pressure continues.
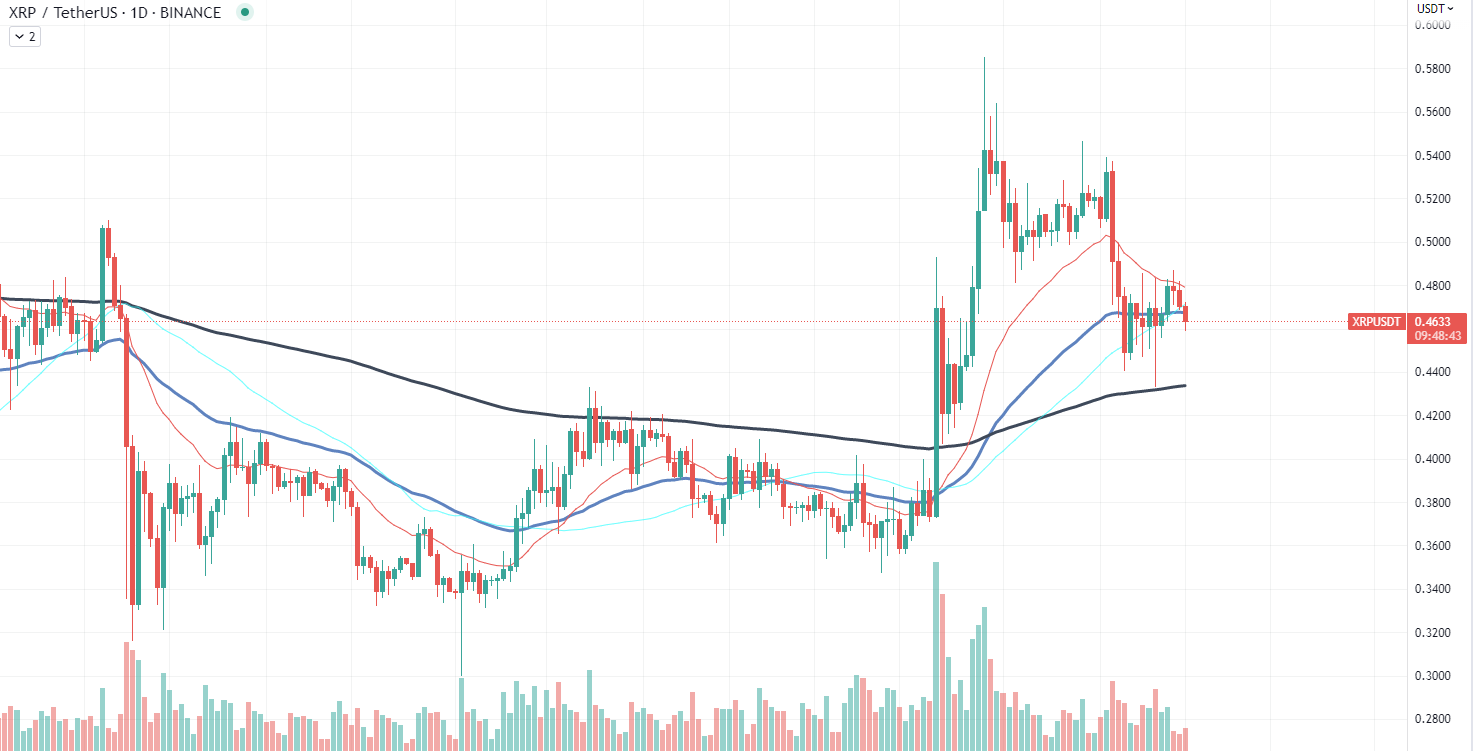
Another concerning pattern for XRP is its constantly declining trading volume. While a decrease in volume can sometimes be a positive sign for an asset in a downtrend, the long-term implications of dwindling volume for XRP point to a potential liquidity issue. As trading volume decreases, it becomes more challenging for investors to buy or sell the asset at their desired price, which could negatively impact XRP's market value.
The Relative Strength Index (RSI) is a popular technical indicator used to gauge the momentum of an asset's price movement. An RSI reading around 40 for XRP suggests that the downtrend may continue, rather than reverse. This bearish signal can be concerning for investors who may have been expecting a trend reversal in the near future. If the RSI continues to remain below the 50 mark, it could indicate that the selling pressure on XRP is still strong, potentially leading to further price declines.
Shiba Inu loses support
Shiba Inu (SHIB) has recently experienced a significant price drop, losing the support level that was previously discussed in earlier articles. The meme cryptocurrency's price has now fallen below the $0.00001 threshold, which raises concerns about its future prospects.
This downward trend indicates that bulls are not in control of the market, despite Shiba Inu's increased burn rate and network activity. Consequently, the meme coin is struggling to maintain its position as an attractive investment option for traders and investors.
The loss of this critical support level may have severe consequences for Shiba Inu. Without a strong foundation, the coin's price could continue to decline, potentially leading to further losses for its holders. This development is particularly concerning given the recent surge in the popularity of meme coins and the overall growth of the cryptocurrency market.
The current situation could also discourage new investors from entering the Shiba Inu ecosystem. With the coin's price falling and the support level breached, potential investors may see the asset as too risky to add to their portfolios. This lack of interest from new market participants could further contribute to the decline in SHIB's value.
Dollar regains strength
The cryptocurrency market has experienced a significant decline today, with many investors searching for reasons behind the sudden drop. One possible explanation could be the recent growth of the U.S. Dollar Index (DXY), which has reached a value of 101 and is displaying strong reversal signs.
The DXY is an index that measures the value of the U.S. Dollar against a basket of foreign currencies. A rise in the DXY generally indicates that the U.S. Dollar is strengthening, while a decline suggests that it is weakening. The recent uptick in the DXY can be attributed to several factors, including positive economic data and higher interest rate expectations in the U.S.
When the DXY strengthens, it often has an inverse relationship with risk assets, including cryptocurrencies. This is because a stronger U.S. Dollar makes it more expensive for investors in other countries to purchase assets denominated in dollars. As a result, demand for these assets may decrease, leading to a decline in their prices.
In the case of the recent DXY growth, the index has bounced off a historic support level, signaling a potential trend reversal. This bounce could be an indication that the U.S. Dollar is entering a new phase of strength, which may negatively impact the crypto market.
Moreover, the strengthening U.S. Dollar can also lead to capital outflows from emerging markets, as investors seek safer investments. As cryptocurrencies are often considered high-risk assets, they may experience increased selling pressure during periods of dollar strength.
 Dan Burgin