
Disclaimer: The opinions expressed by our writers are their own and do not represent the views of U.Today. The financial and market information provided on U.Today is intended for informational purposes only. U.Today is not liable for any financial losses incurred while trading cryptocurrencies. Conduct your own research by contacting financial experts before making any investment decisions. We believe that all content is accurate as of the date of publication, but certain offers mentioned may no longer be available.
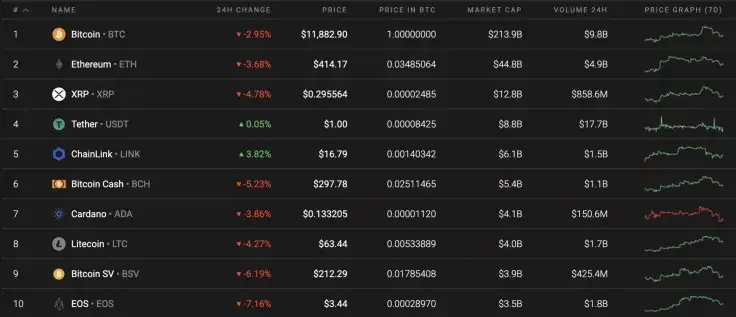
The correction has reached almost all coins from the Top 10 list except for Chainlink (LINK), whose rate has increased by 2.29% since yesterday. Meanwhile, the top loser is EOS, which has lost more than 7%.
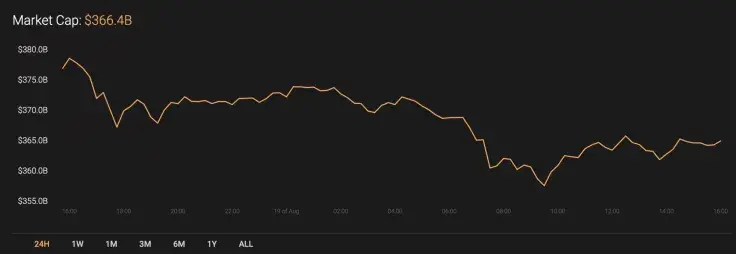
The current decrease in the market has negatively affected the total capitalization index, which has declined by $12 bln and now stands at $365 bln.
The key data for XRP is looking the following way:
-
Name: XRP
Advertisement -
Ticker: XRP
-
Market Cap: $13,294,613,263
-
Price: $0.295813
Advertisement -
Volume (24h): $2,189,804,611
-
Change (24h): -4.49%
The data is relevant at press time.
XRP/USD: Can the altcoin come back to $0.30 by the end of the month?
The XRP price yesterday suspended its decline at the level of average prices, but this morning the pullback continued below the POC indicator line ($0.294). During the European session, the pair will reach support at $0.280. At the moment, it is the biggest loser out of the Top 3 coins.
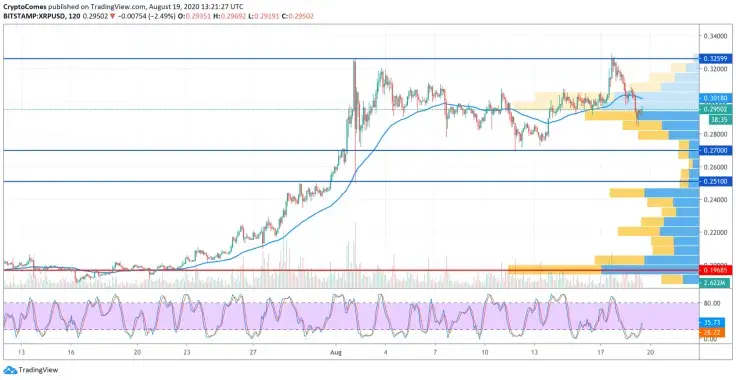
One might assume that, in this area, the decline will slow down significantly, and the daily minimum will be around the $0.270 mark.
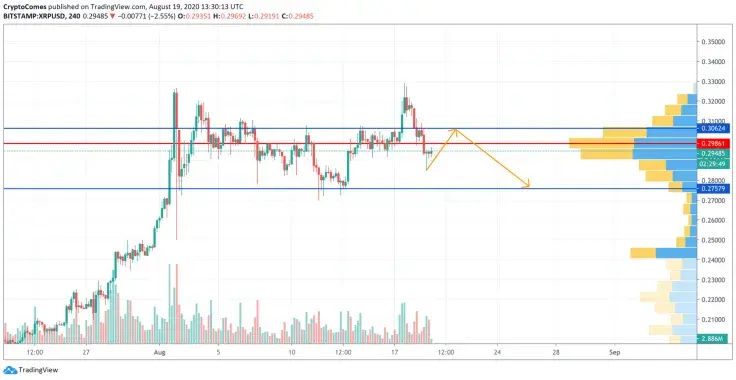
On the 4H chart, XRP has found a local support at $0.2850. Even though the decline might not have finished yet, bulls are about to make a retest of the $0.30 mark followed by a deeper price drop.
If a false breakout of $0.30 is confirmed, bears may push XRP to the support of $0.2757 which can be achieved by the end of August.
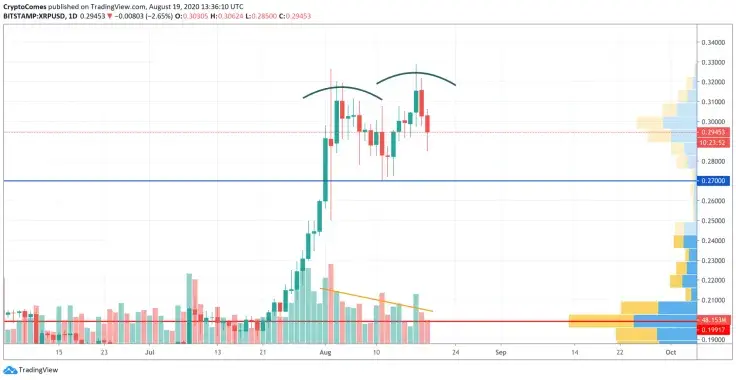
In the longer term, XRP has formed a double top pattern, which is considered a reversal. Thus, the declining trading volume confirms such a scenario, as well as a low liquidity level. Currently, bears dominate the market; the trend may change when the coin gets to the important support level at $0.27.
XRP is trading at $0.2940 at press time.
 Gamza Khanzadaev
 Yuri Molchan
 Arman Shirinyan
 Alex Dovbnya