
Disclaimer: The opinions expressed by our writers are their own and do not represent the views of U.Today. The financial and market information provided on U.Today is intended for informational purposes only. U.Today is not liable for any financial losses incurred while trading cryptocurrencies. Conduct your own research by contacting financial experts before making any investment decisions. We believe that all content is accurate as of the date of publication, but certain offers mentioned may no longer be available.
Recent data shows a 730 million XRP outflow from the network's payment volume, which has greatly hampered XRP's price recovery. The asset's capacity to sustain upward momentum is called into question by this drop in transactional activity, which indicates waning investor confidence.
Following an attempt to breach significant resistance levels XRP has had difficulty maintaining its upward trajectory. The price did not benefit from the recovery of the wider market and recently stayed around $2.32. Because they have served as dynamic resistance zones, the 50-day and 100-day moving averages have kept XRP from regaining ground that it has lost.
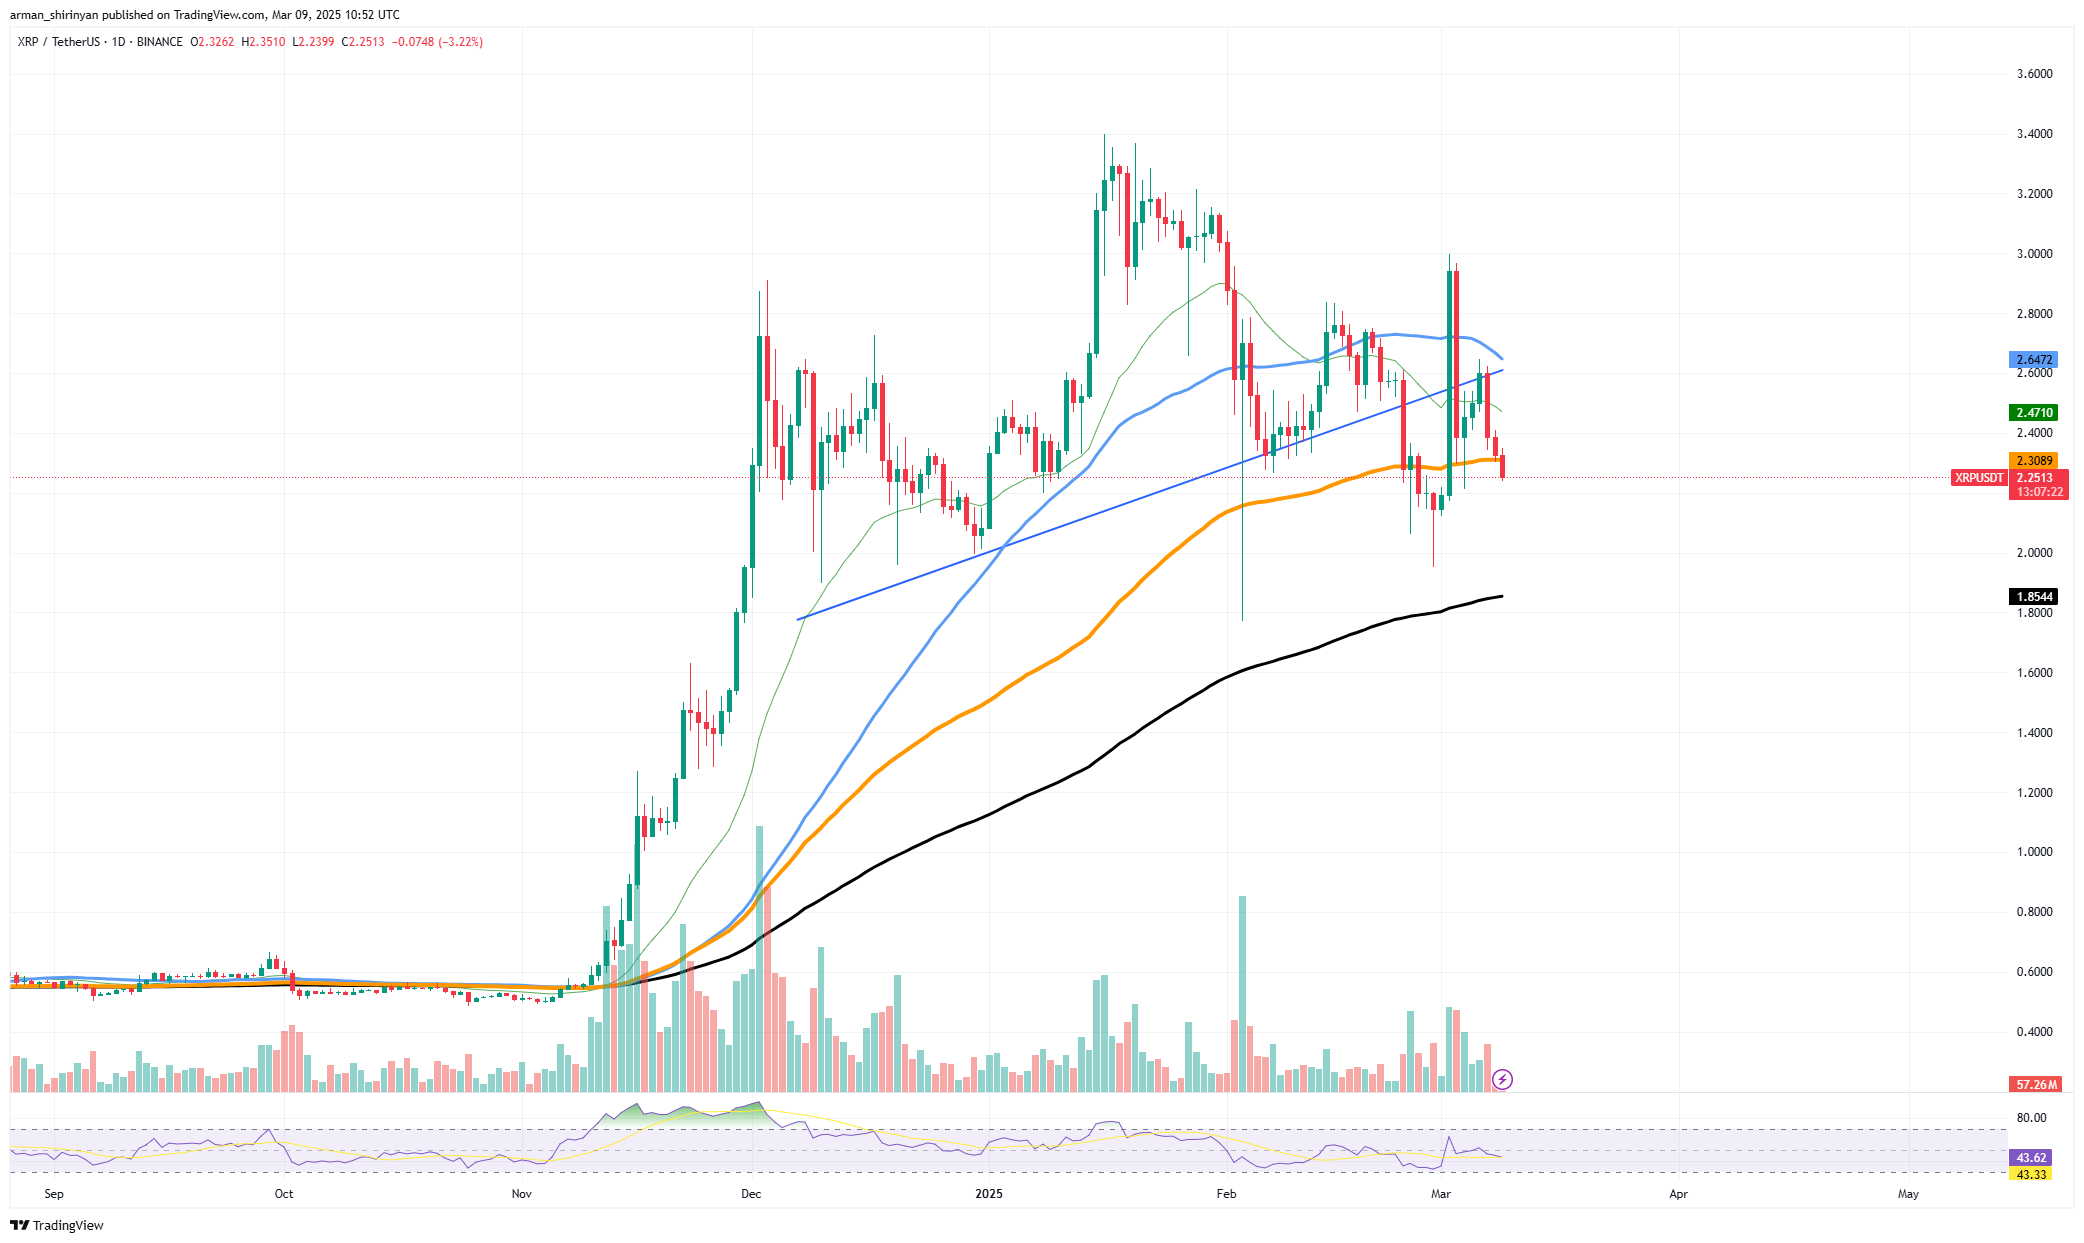
The asset has been marking lower highs on the price chart, which suggests that buying pressure may be waning. The most worrisome aspect of XRP's slow recovery is the sharp decline in its volume of on-chain payments. A considerable drop in transactional activity is reflected in the 730 million XRP drop, which raises concerns about the general health of the network.
Reduced adoption and utility are typically indicated by a significant drop in payment volume, which is concerning for any asset trying to recover. Crypto market price rallies have historically been preceded by robust network activity. But according to the most recent data, user engagement and capital flows within the ecosystem are still lacking even in spite of XRP's prior price spikes.
Bitcoin has not found success
Recent volatility in the price trajectory of Bitcoin has made it difficult for the asset to maintain momentum above $90,000. The cryptocurrency may be at a turning point according to recent indicators, despite a historic uptrend. The 1,460-day running ROI chart is displaying a downward trajectory that may have major ramifications for the future movement of the price of Bitcoin.
Bitcoin was recently pushed back toward the 100-day moving average after an unsuccessful attempt to break through the $90,000 resistance level. The declining trading volume indicates that both institutional and retail investors are pulling back, as there is not any significant buying pressure. Bitcoin may experience more downward pressure toward the $85,000 mark if it is unable to recover important resistance levels around $92,500. The BTC ROI chart presents an unnerving image.

With a current value of 1.558, the long-term return on investment for Bitcoin has been steadily declining. This indicates declining long-term-holder profitability, a metric that has historically affected market sentiment. The worry is that Bitcoin is getting closer to a point where it might find it difficult to provide sizable returns in comparison to earlier cycles, even though previous cycles have shown strong recoveries after reaching low ROI values.
Investor excitement may be tempered if Bitcoin's return on investment (ROI) approaches 1.0, which might signal a breakeven point where long-term holders are neither profiting nor losing money. These low ROI levels have, however, historically indicated accumulation points prior to significant price spikes. A reversal toward $100,000 is still possible if Bitcoin is able to hold support above $85,000 and overcome significant resistance at $90,000.
Shiba Inu breaks forward
As the digital asset tries to break through the crucial resistance level of $0.000013, Shiba Inu is once again gaining ground. With a significant rise in trading volume and a string of higher lows developing on the chart, SHIB has demonstrated signs of recovery after a protracted period of consolidation and downward pressure. Now the question still stands: is this the start of a significant breakout?
The $0.000013 mark, which has served as both support and resistance in past market movements, is currently where SHIB's price action is centered. An immediate rally toward the next significant resistance levels at $0.000016 and $0.000018 could be triggered by a clear break above this level.

The current technical setup indicates that a similar situation could occur, as Shiba Inu has historically experienced explosive price movements when breaking through consolidation zones. SHIB is benefiting from a number of bullish indicators. Without yet hitting overbought territory, the Relative Strength Index (RSI) is getting closer to the midline, indicating growing buying momentum. Furthermore, a breakout above the declining trendline that has constrained SHIB's price movement for weeks could lead to a surge in fresh buying activity. Furthermore, an increase in accumulation, which usually comes before price increases is indicated by SHIB's volume profile.
The greater volume of transactions lends credence to the theory that institutional investors and whales might be lining up for a possible breakout. Although there is increasing optimism, SHIB traders should exercise caution.
There will probably be another retracement toward the $0.000012 support level if the asset is unable to close above $0.000013 with significant volume. If this level is rejected, it may indicate more downward pressure, postponing any possible breakout and maintaining SHIB's extended consolidation phase.
 Dan Burgin
 U.Today Editorial Team