
Disclaimer: The opinions expressed by our writers are their own and do not represent the views of U.Today. The financial and market information provided on U.Today is intended for informational purposes only. U.Today is not liable for any financial losses incurred while trading cryptocurrencies. Conduct your own research by contacting financial experts before making any investment decisions. We believe that all content is accurate as of the date of publication, but certain offers mentioned may no longer be available.
XRP's recent performance has been under intense scrutiny, especially with its inability to break through the 50 EMA and establish a foothold above it. This situation is critical for XRP as failing to overcome this resistance level raises the risk of a further correction, potentially halting the current rally.
XRP's inability to break through the 50 EMA certainly raises some concerns as, at this point in time, the asset is clearly struggling to maintain the current momentum.
The 50-day Exponential Moving Average is acting as a good resistance to the price with the blue trendline. The fact that XRP struggles to float above this line adds some negativity to the mix, meaning one can read that bulls are not strong enough to hold on given the existing momentum. It has to be convincingly across this 50 EMA to have any hope of a continuation rally.
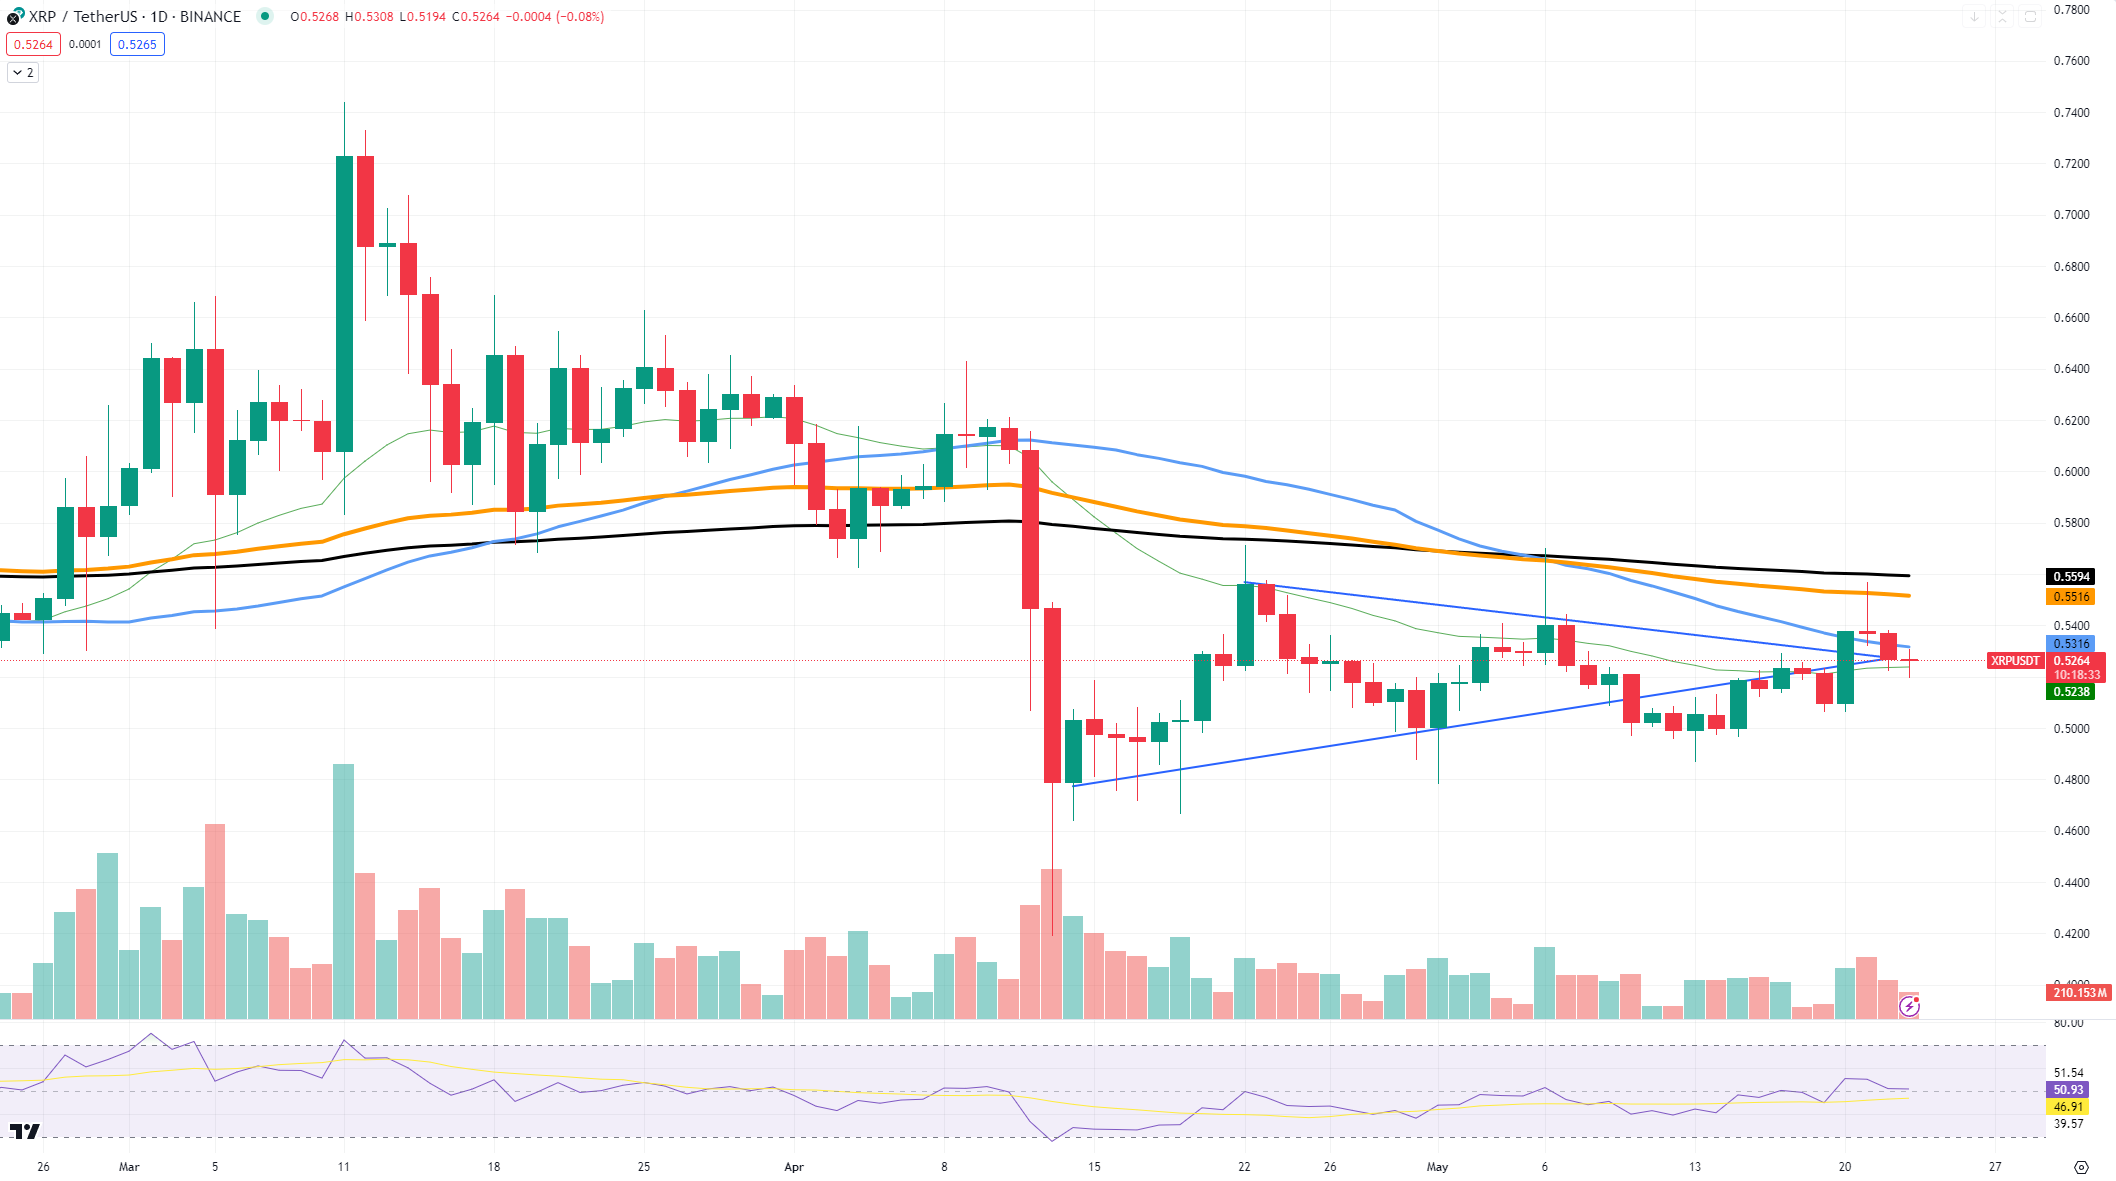
Further complicating matters, the Bollinger Bands are showing absolutely no expansion right now — generally a leading indicator for rising volatility and more room for price action to develop. In fact, they are barely tight, suggesting more consolidation for the time being than any kind of clear bullish breakout.
However, there is that possible watershed level around $0.53. Here, if XRP manages to cross over this level, then it could light up new buying interest. But trading should be focusing on the $0.55 and $0.61 price thresholds. These are resistance points to get past before confirming the XRP trend and nullifying the potentially bigger price correction.
The Relative Strength Index is at 52.31, showing neutrality on the market. This would suggest that XRP could break either way, something that will depend on market sentiment and other extraneous factors. Levels above 70 would indicate overbought conditions, and a drop below 30 would point toward oversold conditions.
Shiba Inu's promising picture
Lately, Shiba Inu has been showing a lot of promise for investors, managing to hold above the 50-day exponential moving average, thereby signifying strength. This is the level of the EMA that has been acting as the support level giving birth to the current price levels, thereby filling buyers with more confidence.
Worthy of focus is the fact that an ascending channel has developed, which typically signals a consolidation phase just before a breakout. This also forms a good base for bulls, with additional support from the 50 EMA. The challenges in price within this channel show that SHIB can be preparing for something more valuable on the upside if current conditions hold.

Even more encouraging is that the current price action has consistency in volume. Normal volume will help the current, prevailing trend to be sustained and further make it potentially lasting. The Relative Strength Index (RSI) resides at 50.98, thus leaving some room for the price to test higher levels before it can make a top.
Look for key resistance levels. SHIB, breaking above recent highs with continued momentum, will have to target much higher levels. On the other hand, holding supports above the 50 EMA will help avoid bearish reversals.
Ethereum to $4,000?
Ethereum remains resilient, extricating itself very slowly but surely from bears, but at this point it cannot manage to break above $3,800. Price data reflects the belief that the indication of strength emanating from the hints to the upcoming price rally is after a correction toward $3,600.
The price action on Ethereum looks good for now. The ETH/USD pair has had to struggle quite a bit to the upside, finding major support around the $3,600 level. This bounce is an important move and should stamp the level as one that is key to a reaction point going forward for Ethereum investors. Trading volume has also soared, making the market even more bullish.

But in terms of technicals, the moving averages are a key indicator: the 50-day moving average (in blue) is now near the 200-day moving average (in orange). Once the 50-day moves above the 200-day, it will have completed a "golden cross," a classic bullish continuation sign. The last time this golden cross took place, it was accompanied by a huge uptick in price for ETH.
If Ethereum can maintain the current momentum and exceed the resistance level at $3,800, it might jump to over $4,000 in its next target. All of this is supported by increased trading volumes and general positive market sentiment.
 Dan Burgin
 U.Today Editorial Team