Disclaimer: The opinions expressed by our writers are their own and do not represent the views of U.Today. The financial and market information provided on U.Today is intended for informational purposes only. U.Today is not liable for any financial losses incurred while trading cryptocurrencies. Conduct your own research by contacting financial experts before making any investment decisions. We believe that all content is accurate as of the date of publication, but certain offers mentioned may no longer be available.
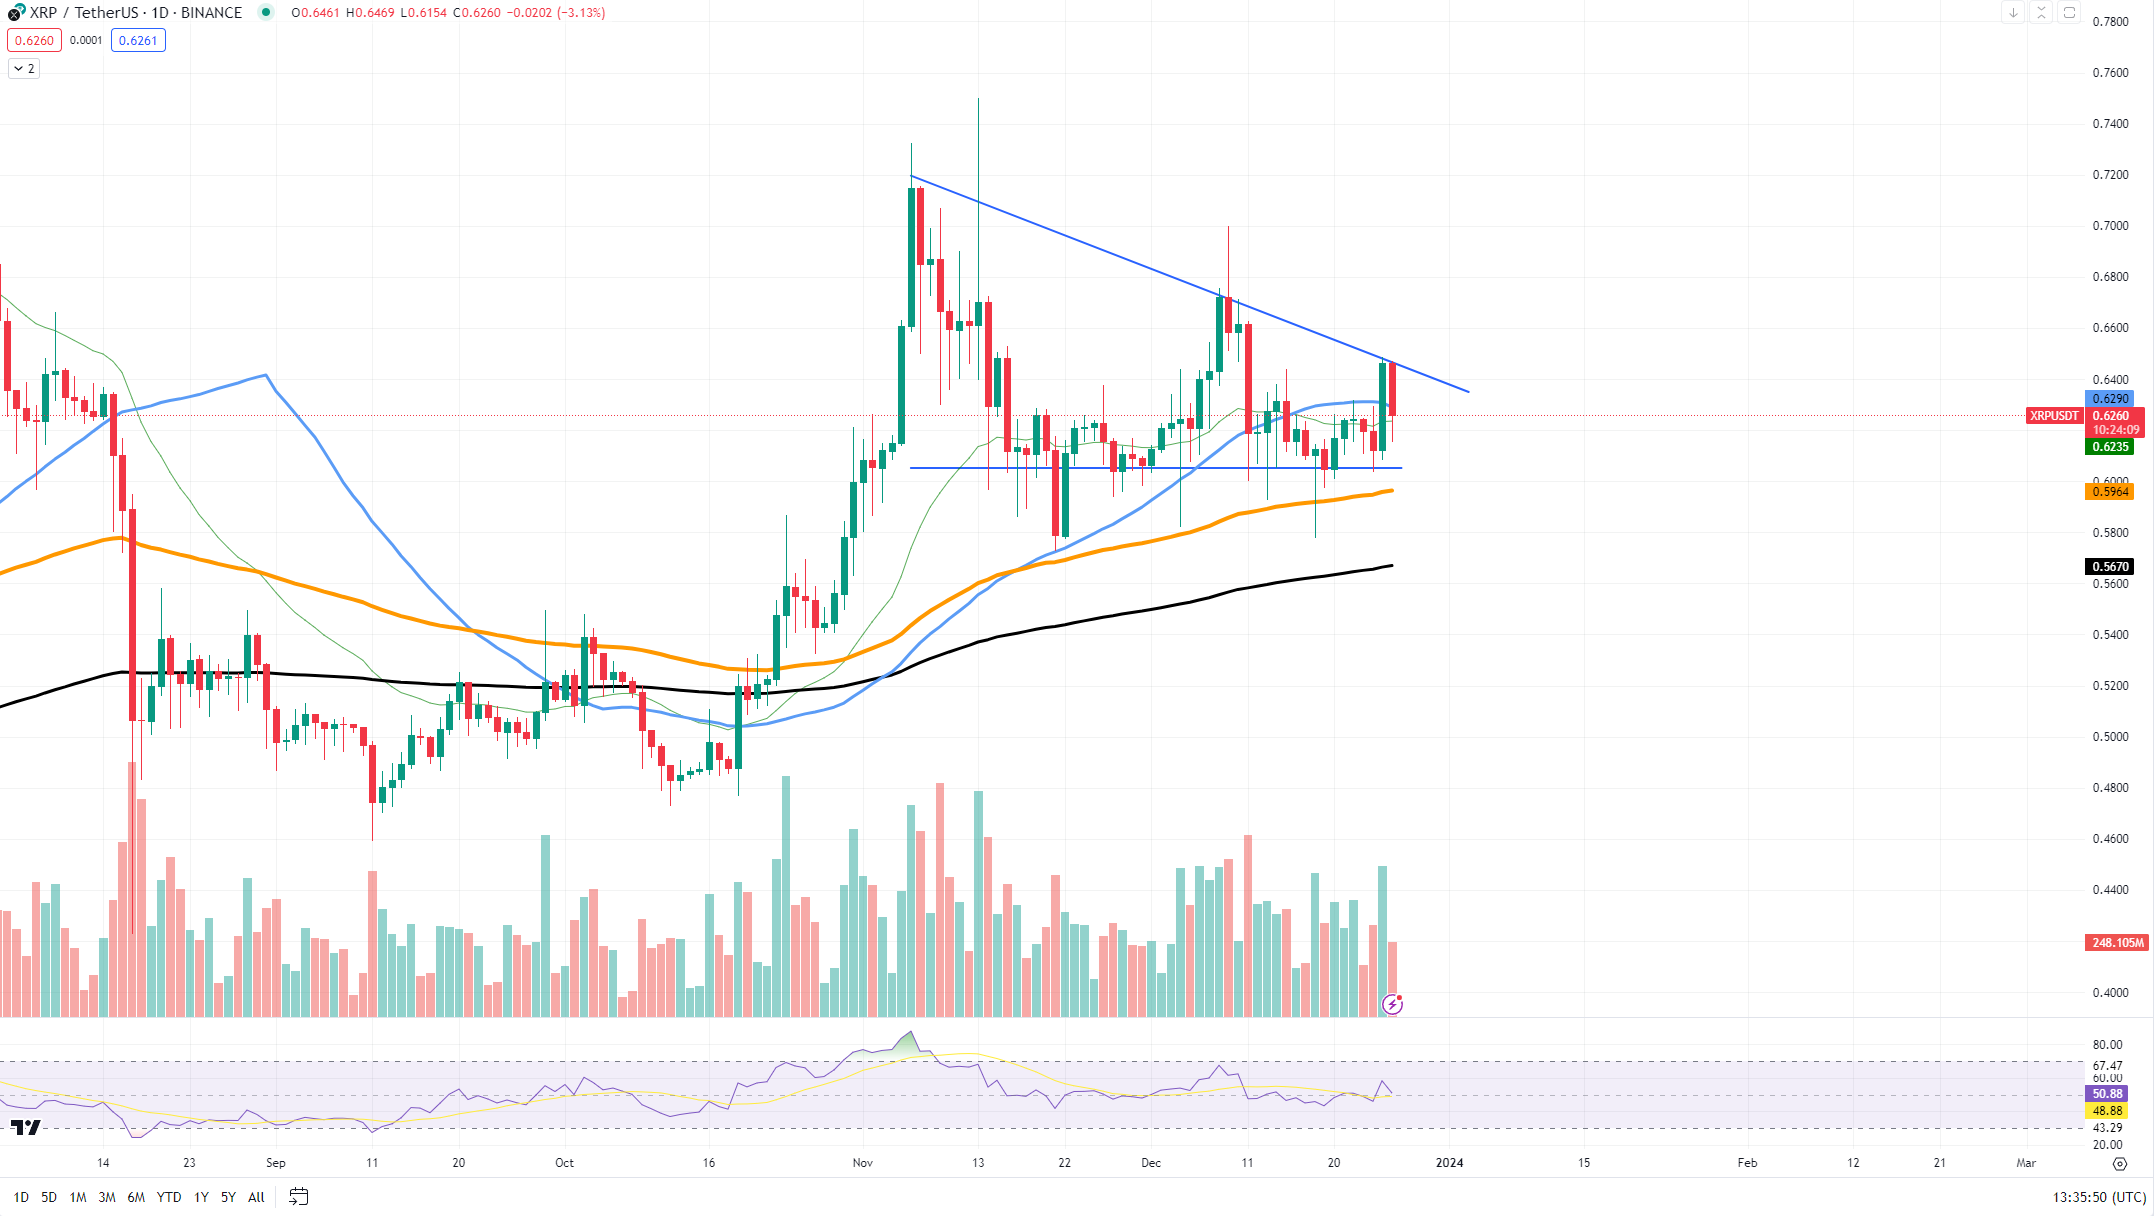
XRP's technical charts are flashing signals of an impending volatility storm as the cryptocurrency forms a critical chart pattern not seen since May 2023. The pattern in question is a descending triangle, recognized for its potential to precipitate significant price moves upon completion.
A descending triangle is characterized by a flat bottom with a series of lower highs forming a downward slope, indicating that sellers are more aggressive than buyers. Typically, this pattern is considered bearish; however, the outcome can be unpredictable, and breakouts can occur in either direction. For XRP, this pattern emerges after months of relative inactivity, suggesting a buildup of tension between buyers and sellers vying for market control.

The significance of this pattern is heightened by its formation after a long period since XRP's last notable technical setup – an inverse head and shoulders pattern in May 2023, which traditionally signals a bullish reversal.
As XRP approaches the apex of the triangle, the converging price action suggests that a breakout is imminent. The flat bottom of the triangle, coinciding with key support levels, will be an area of focus for traders. A decisive break below this support could confirm the bearish bias of the pattern, leading to a potential sell-off. Conversely, a breakout above the descending trendline could invalidate the bearish sentiment and catalyze a sharp reversal to the upside.
The current chart indicates that XRP has been testing the triangle's lower boundary, with the price bouncing back from the support level, hinting at a possible reversal.
Ethereum takes punch
Ethereum recently encountered a sudden surge of selling pressure after a period of upward momentum in which ETH broke through local resistance levels, signaling potential bullish behavior. Yet, the tide turned, and the price saw a retracement, bringing it to the 26-day Exponential Moving Average (EMA), a critical juncture on the price chart.
The 26 EMA serves as a dynamic level that often acts as a short-term barometer for price momentum. The recent touchpoint where Ethereum's price bounced off this moving average is significant. It suggests that, despite downward pressure, there is still underlying buying interest at this level. Such a bounce may be indicative of a price reversal, as buyers step in to uphold Ethereum's value.
The current chart shows Ethereum's resilience at the 26 EMA, suggesting that the recent price drop could be a consolidation phase rather than the start of a deeper correction. This bounce-off could be the precursor to a reversal, especially if Ethereum maintains support above the 26 EMA and starts to form a series of higher lows.
Shiba Inu ascends, but for how long?
The Shiba Inu chart reveals SHIB maintaining an uptrend, an encouraging sign for investors fearing a significant pullback.
SHIB is currently trending above its significant moving averages, which often act as dynamic support levels. The token has recently tested these averages, and so far, it has bounced off them, suggesting that the uptrend is still intact. This price action is a classic indication of bullish momentum, with higher lows occurring one after another.
The volume profile during the recent price movements has not indicated any substantial panic selling. The sell-offs appear controlled, and buying volumes during the bounces have been adequate to sustain the uptrend. This suggests that, despite the correction, investor sentiment toward SHIB remains optimistic.
Additionally, other technical indicators such as the RSI are hovering around the mid-range, far from oversold territory. This provides more room for potential upward movement before the token becomes overbought, a state that could trigger a more pronounced correction.
One key observation is the formation of higher lows, a pattern that is typically bullish. As long as SHIB continues to make higher lows, the uptrend is considered to be in play.

 Tomiwabold Olajide
 Caroline Amosun
 Dan Burgin
 Godfrey Benjamin