Disclaimer: The opinions expressed by our writers are their own and do not represent the views of U.Today. The financial and market information provided on U.Today is intended for informational purposes only. U.Today is not liable for any financial losses incurred while trading cryptocurrencies. Conduct your own research by contacting financial experts before making any investment decisions. We believe that all content is accurate as of the date of publication, but certain offers mentioned may no longer be available.
The situation in the market has remained relatively unchanged over the weekend. All of the coins from the Top 10 list are in the relatively bullish zone. The altcoins are showing better price dynamics than Bitcoin (BTC), which continues to trade sideways.
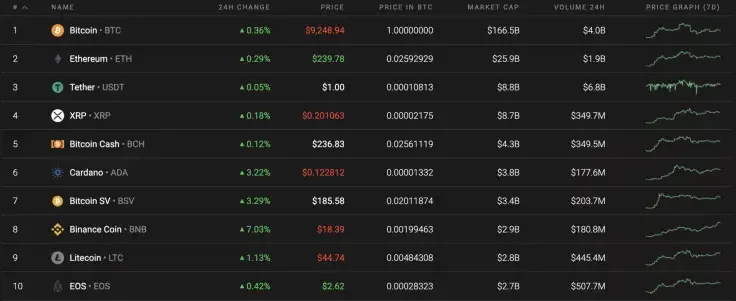
Below are the indicators for Bitcoin (BTC), Ethereum (ETH), and XRP and how they're doing today:
|
Name |
Ticker Advertisement
|
Market Cap |
Price |
Volume (24H) Advertisement
|
Change (24H) |
|
Bitcoin |
BTC |
$170,776,631,958 |
$9,265.89 |
$13,058,948,747 |
0.47% |
|
Ethereum |
ETH |
$26,835,456,631 |
$240.19 |
$5,664,558,645 |
0.33% |
|
XRP |
XRP |
$8,908,375,124 |
$0.201284 |
$815,077,827 |
0.30% |
BTC/USD
The rate for the chief crypto has remained relatively unchanged over the last 7 days. Bitcoin (BTC) has gone up by 2.39%, and the price change since yesterday has gone up +0.42%.

Looking at the daily time frame, the volatility is at its lowest level, which means that one might expect a sharp move next week. As Bitcoin (BTC) continues to be located above $8,500 mark, the bullish scenario prevails over the bearish tone. As the more likely scenario, the price may continue to fall until the $8,900 mark, followed by a continued upswing to above $9,500. The high level of liquidity is in the $9,300-$9,600 area.
At press time, Bitcoin was trading at $9,252.
ETH/USD
Ethereum (ETH) is showing almost the same price action as Bitcoin (BTC). The rate for the leading altcoin has increased by 0.36% over the last 24 hours.
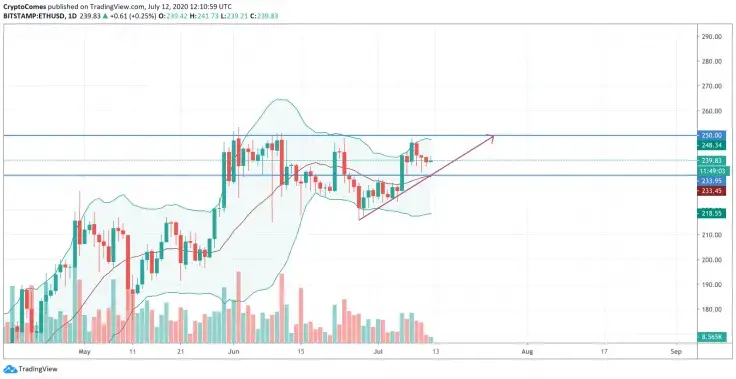
According to the chart, Ethereum (ETH) is located around the $240 mark and against a declining trading volume. Before a rise continues, the altcoin might retest the basic line of the Bollinger Bands at $234 in order to gain enough strength to continue its upswing. If that occurs, then the next resistance mark is at $250, which the bulls may achieve by the end of the month.
At press time, Ethereum was trading at $239.82.
XRP/USD
XRP has shown a much more significant price change over the last week as compared to Bitcoin (BTC) or Ethereum (ETH). The rate for the altcoin has skyrocketed up by 14.20%.
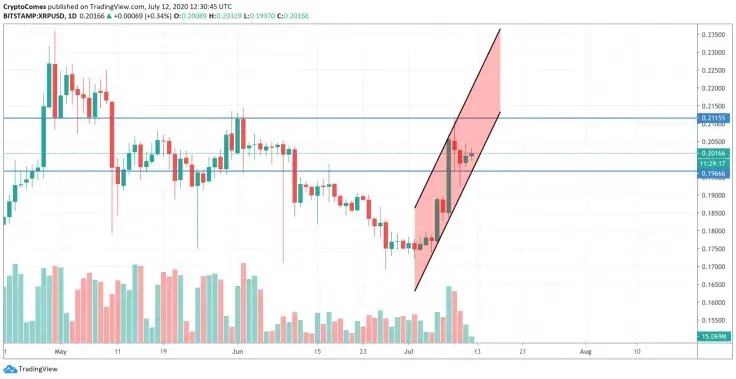
Although the price of XRP has a significant amount over from the last time, it still has potential room to grow. For the moment, its trading volume is low which means that growth is possible after a retest of $0.1966. If the volume increases, then the rise might last until $0.2115. Such a projection is relevant for the upcoming week.
At press time, XRP was trading at $0.2016.
 Dan Burgin
 U.Today Editorial Team