
Disclaimer: The opinions expressed by our writers are their own and do not represent the views of U.Today. The financial and market information provided on U.Today is intended for informational purposes only. U.Today is not liable for any financial losses incurred while trading cryptocurrencies. Conduct your own research by contacting financial experts before making any investment decisions. We believe that all content is accurate as of the date of publication, but certain offers mentioned may no longer be available.
Solana (SOL), one of the leading blockchain platforms, is showing promising signs on the charts. As of the latest data, Solana has positioned itself at the local top of its current trend, hinting at a potential bullish crossover in the near future. Currently priced at $22, the cryptocurrency is maintaining its stance above the 50-day moving average, a critical indicator for traders and analysts alike.
The convergence of moving averages is a phenomenon closely watched by market participants. In Solana's case, the moving averages are drawing closer together, suggesting the possibility of a "golden cross." For the uninitiated, a Golden Cross occurs when a short-term moving average, such as the 50-day, crosses above a long-term moving average, like the 200-day. Historically, this pattern has been a bullish signal, often indicating the potential onset of a long-term uptrend.
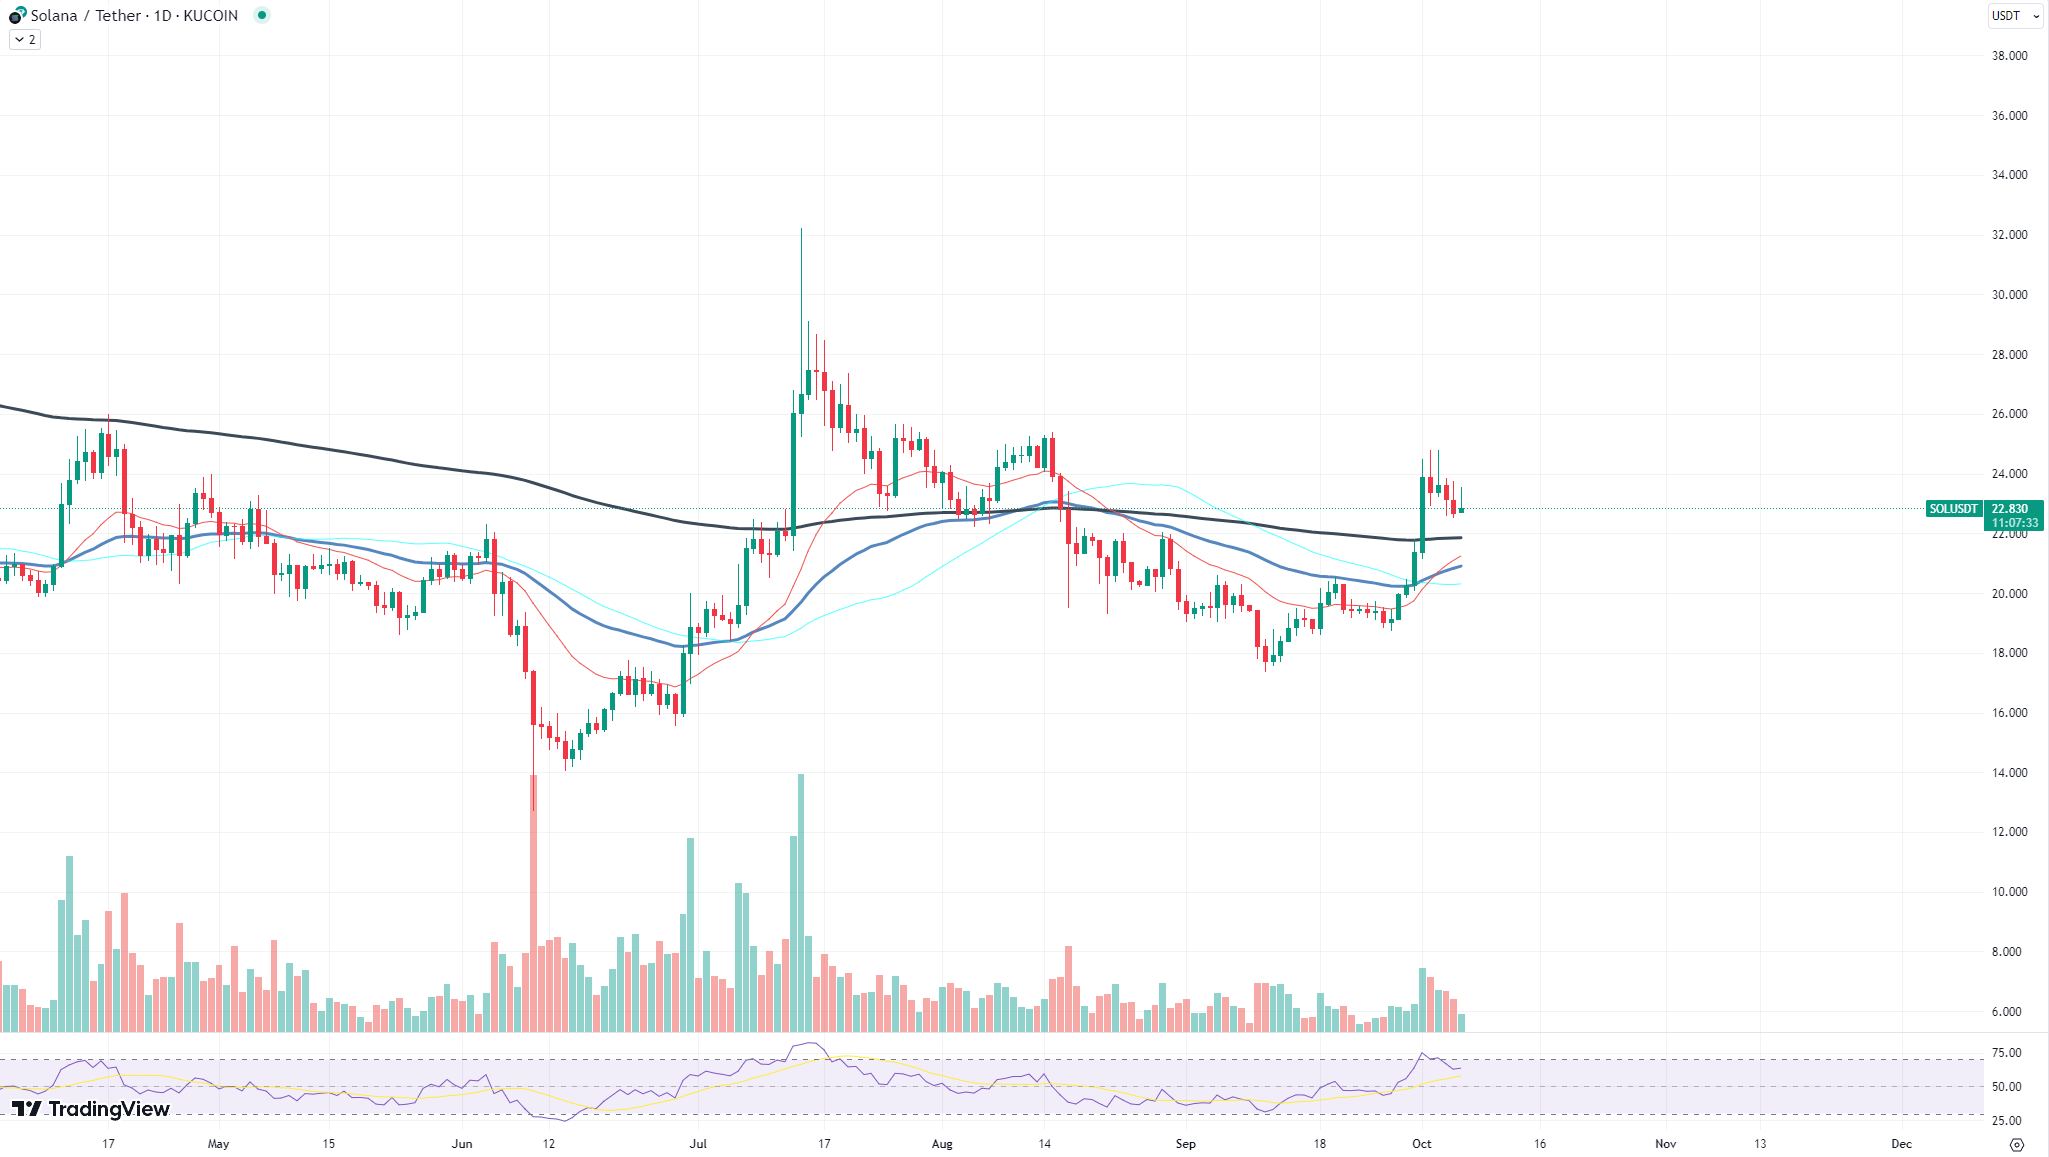
However, while the charts paint a rosy picture, there are other metrics to consider. The Relative Strength Index (RSI), a momentum oscillator that measures the speed and change of price movements, is currently on the higher side for Solana. A high RSI often suggests that an asset might be overbought, which could lead to a price reversal. It is crucial for investors to keep an eye on this, as an overbought condition might temper the bullish sentiment arising from the potential golden cross.
Bigger picture for XRP
Currently, XRP is trading at approximately $0.5215. Over the past three days, the asset has witnessed a decline, which might have caused some investors to raise their eyebrows. However, when we zoom out and consider the performance of XRP over the past two weeks, a different story emerges.
For more than two weeks, XRP has been on an upward trajectory. This uptrend is significant, especially when considering the volatile nature of the cryptocurrency market. A three-day price drop, in this context, can be seen as a minor correction or consolidation phase rather than a reversal of the trend.
Analyzing the price charts, there is a hidden trendline support that XRP has been respecting. This trendline has acted as a crucial support level, ensuring that the asset does not plummet further. Every time XRP approached this trendline, it bounced back, indicating strong buying interest at those levels.
The fact that XRP remains in an uptrend despite the recent price drop is a testament to its resilience and the confidence of its investor community. It is not uncommon for assets to undergo corrections during a broader uptrend. These corrections are healthy and often provide an opportunity for new investors to enter the market.
Cardano comes back
Cardano (ADA) has shown promising signs of a potential rally. The digital asset has recently managed to climb back above the 50 Exponential Moving Average (EMA), a significant technical indicator that traders often monitor.

Currently trading at $0.2643, ADA's move above the 50 EMA is a bullish sign. The 50 EMA often acts as a dynamic support or resistance level, depending on the asset's position relative to the EMA. When a cryptocurrency trades above the 50 EMA, it indicates that the short-term momentum is in favor of the bulls. Conversely, trading below this level can suggest bearish momentum. For ADA, reclaiming this level suggests that the bulls are attempting to regain control.
Despite facing a minor setback recently, Cardano's resilience is evident as it has managed to break above a key resistance level. With this momentum, the path toward the 200 EMA seems clearer. The 200 EMA is another crucial technical indicator that represents a longer-term trend. A move toward this level could further solidify ADA's bullish stance on the market.
 Dan Burgin