Disclaimer: The opinions expressed by our writers are their own and do not represent the views of U.Today. The financial and market information provided on U.Today is intended for informational purposes only. U.Today is not liable for any financial losses incurred while trading cryptocurrencies. Conduct your own research by contacting financial experts before making any investment decisions. We believe that all content is accurate as of the date of publication, but certain offers mentioned may no longer be available.
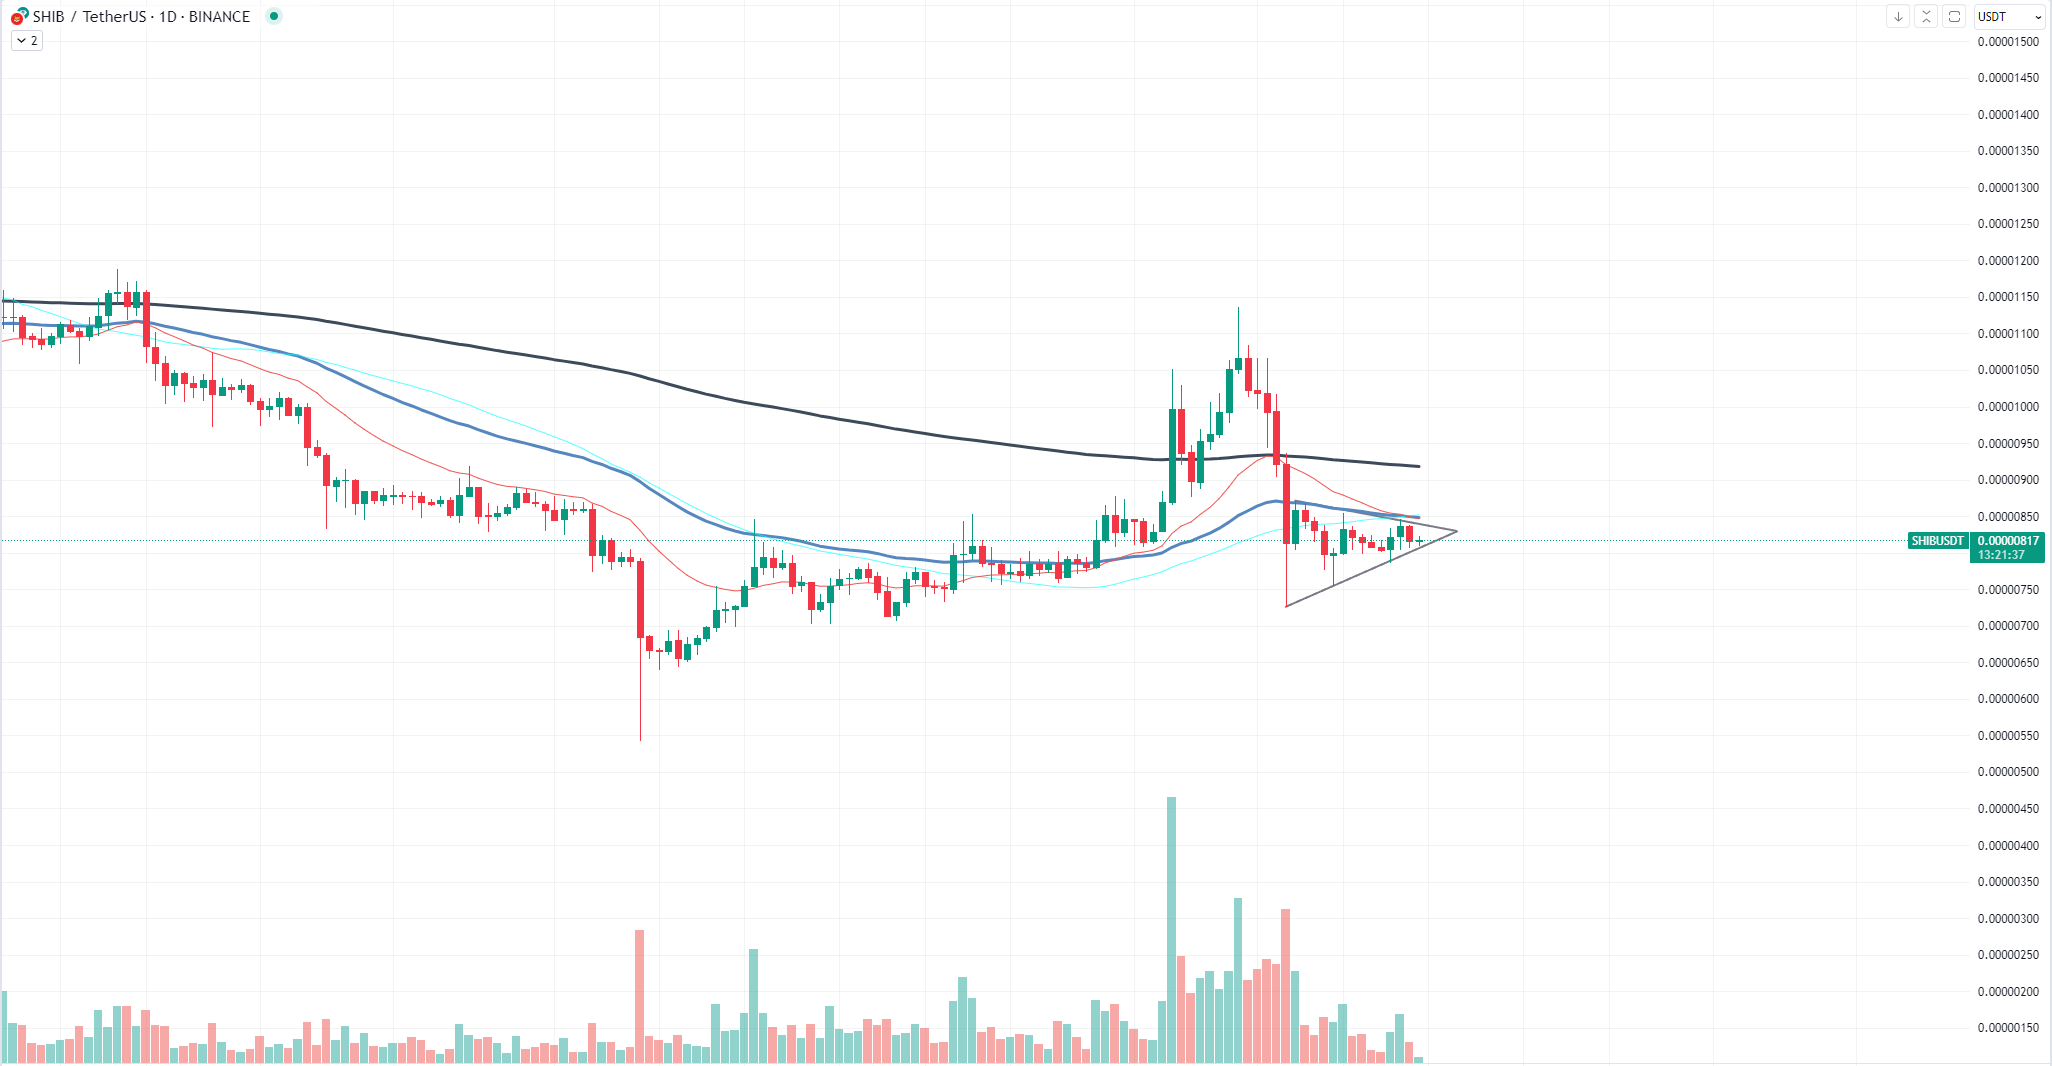
The Shiba Inu (SHIB) token has been drawing attention lately, not just for its meme status but also for a technical pattern forming on its price chart — a symmetrical triangle. This pattern is often considered a continuation pattern, meaning it usually signals the direction the asset will take following a period of consolidation.
What is a symmetrical triangle?
A symmetrical triangle is a chart pattern that looks like a triangle, where the price moves within two converging trendlines. This pattern can break out in either direction — upward or downward — and is generally considered to be a period of market indecision. The breakout direction often indicates likely future price movement.

As of the latest data, Shiba Inu is trading at approximately $0.00000818. The asset has been moving within the confines of a symmetrical triangle, and traders are keenly watching for a breakout.
For Shiba Inu, this symmetrical triangle could be a defining moment. The pattern usually suggests that the asset will continue in the direction it was going before entering the triangle. Given that Shiba Inu has had a mixed performance recently, a breakout could signal a strong move in either direction.
Burn rate surges by 150%
Adding fuel to the speculative fire is the recent 150% surge in the Shiba Inu token burn rate. A higher burn rate generally makes an asset scarcer, which can drive up demand and potentially raise the price. This could act as a catalyst for SHIB as it approaches the apex of its symmetrical triangle.
While the symmetrical triangle is not a guaranteed indicator of future price action, it does provide traders with a framework for potential outcomes. Given the current market conditions and the surge in the burn rate, a bullish breakout is within the realm of possibility.

 Vladislav Sopov
 Dan Burgin