Disclaimer: The opinions expressed by our writers are their own and do not represent the views of U.Today. The financial and market information provided on U.Today is intended for informational purposes only. U.Today is not liable for any financial losses incurred while trading cryptocurrencies. Conduct your own research by contacting financial experts before making any investment decisions. We believe that all content is accurate as of the date of publication, but certain offers mentioned may no longer be available.
Shiba Inu (SHIB) has made a significant move, breaking through a key resistance level that could signal the beginning of a new rally. Technical analysts and SHIB enthusiasts are closely watching as the digital token reclaims its position above the 200-day Exponential Moving Average (EMA) — a widely regarded indicator that often acts as a barrier between the bearish and bullish territories.
The daily chart of Shiba Inu reveals a decisive close above the 200 EMA, a move that has historically been followed by a period of substantial price increases. The 200 EMA is a critical technical level that smooths out price data over the past 200 days and is closely monitored by traders for signs of long-term trend reversals. For SHIB, which has been trading below this level for an extended period, the recent surge above it is a noteworthy development.
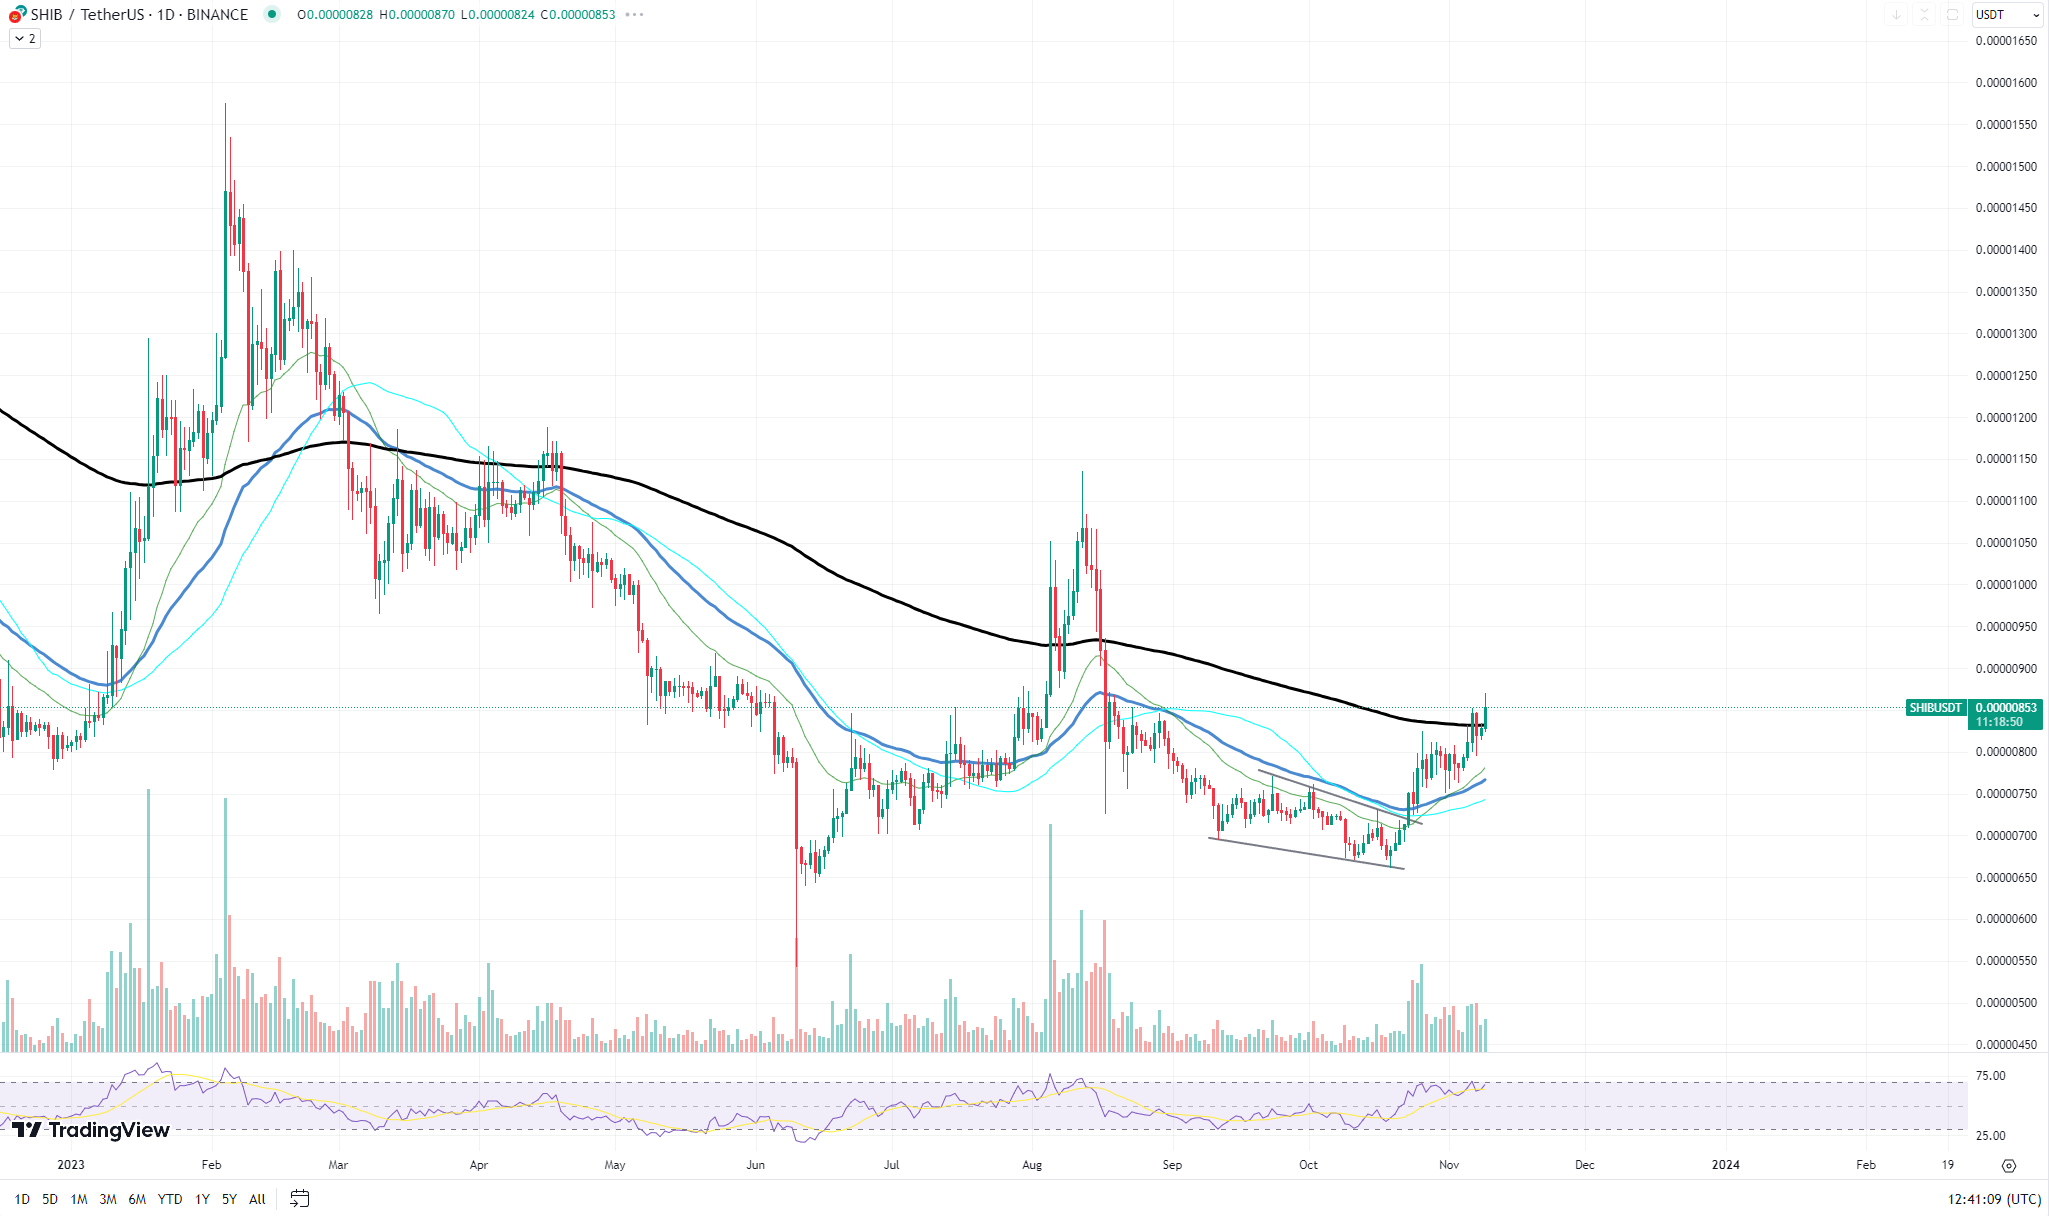
The significance of this event is twofold. First, surpassing the 200 EMA suggests that sentiment toward SHIB is turning positive, as the token demonstrates strength by overcoming a level that previously acted as resistance. Secondly, this breakthrough may attract further buying pressure, as technical traders and algorithms often use the 200 EMA as a trigger for entry into the market.
However, whether this will translate into a sustained new rally for SHIB is contingent upon several factors. Market participants would need to observe follow-through buying and volume in the coming days to confirm the potential for a continued uptrend. Moreover, the past performance of SHIB has been characterized by high volatility and rapid price swings, making it imperative for traders to remain cautious.
This level is problematic for Solana
Solana (SOL) finally approaches a critical resistance level at $48. This level is considered the first major hurdle for Solana since its recent bullish momentum began, and it has not faced significant selling pressure of this magnitude in its current cycle.
The $48 mark represents a pivotal moment for Solana's price trajectory. Historically, it is a level where the asset has either faced considerable resistance or one that it has not ventured into for an extended period, making the current approach a significant test of its market strength.

A breakthrough above this level could indicate a strong conviction from buyers and potentially lead to new highs. However, if the price fails to sustain above $48, it might trigger profit-taking and lead to a pullback.
In terms of technical indicators, there are no immediate signs of a rally fading. However, one metric that often provides clues about future price movements is trading volume. For Solana, the trading volume has been showing signs of decline as prices have ascended, which could be interpreted as a fading momentum. This divergence between rising prices and falling volume is traditionally viewed with caution, as it may suggest that the current price increase is not supported by strong buying interest.
Cardano shows dominance
Cardano (ADA) has recently showcased a formidable ascent in the cryptocurrency market, with a surge that seems to render it unstoppable at first glance. Yet, as any seasoned trader would caution, the markets are fickle, and a reversal could occur at any moment, especially when an asset enters a massive overbought state, as indicated by Cardano's current technical readings.
The Relative Strength Index (RSI), a momentum oscillator that measures the speed and change of price movements, indicates that ADA is in an overbought condition. Traditionally, an RSI above 70 suggests that an asset may be overvalued and could be primed for a potential price correction or reversal. For Cardano, the RSI hovering at these levels raises the specter of a possible pullback, as traders might start to take profits after such a swift rally.
 Dan Burgin
 U.Today Editorial Team