
Disclaimer: The opinions expressed by our writers are their own and do not represent the views of U.Today. The financial and market information provided on U.Today is intended for informational purposes only. U.Today is not liable for any financial losses incurred while trading cryptocurrencies. Conduct your own research by contacting financial experts before making any investment decisions. We believe that all content is accurate as of the date of publication, but certain offers mentioned may no longer be available.
After the SEC approved Ethereum ETFs on Thursday, March 23, Ether has yet to show signs of growth. For Bitcoin, it took almost a month after the ETF approval before the price could set on a massive bull run, reaching an all-time-high of $73,738.00 on March 14.
In September 2022, Ethereum moved to proof of stake (PoS), a set of interconnected upgrades that made Ethereum more secure and sustainable. Proof of stake substitutes computational power with staking (making it less energy-intensive) and replaces miners with validators, who stake their cryptocurrency holdings to activate the ability to create new blocks.

The growing popularity of Ether dApps prompts traders to diversify their portfolios. A closer look at the BTC/ETH correlation could hint the possibility of the Ethereum price finally picking up the pace.
BTC/ETH correlation coefficient
The BTC/ETH correlation refers to the price relationship between Bitcoin (BTC) and Ethereum (ETH), typically expressed in terms of BTC. For example, if Bitcoin is priced at $60,000 and Ethereum at $3,000, the ratio is 0.05, meaning it costs 0.05 BTC to buy one ETH. If ETH's price increases faster than BTC's, the ratio rises, indicating it costs more BTC to buy ETH.
Another measure of this relationship is the correlation coefficient, ranging from -1 to 1. A coefficient of 1 indicates that BTC and ETH move in the same direction, -1 indicates they move in opposite directions, and 0 signifies no correlation. For instance, during periods of negative correlation, if BTC's price rises, ETH's price would fall, and vice versa.
Thus, the BTC/ETH correlation shows the price relationship between the two assets, while the correlation coefficient measures how their prices move relative to each other. Both metrics are crucial for efficiently trading the BTC/ETH correlation.
Historic correlation
Historical data shows that Ethereum tends to be priced higher during bull markets. For instance, ETH was priced above 0.05 BTC during the bull runs of 2018 and 2021. After 2021, the 0.05 BTC level has consistently served as a strong support region. Conversely, the 0.08 BTC level has acted as significant resistance on three separate occasions.
During the BTC bull run, the correlation had been steadily growing, peaking on March 14, when the BTC price reached an ATH.
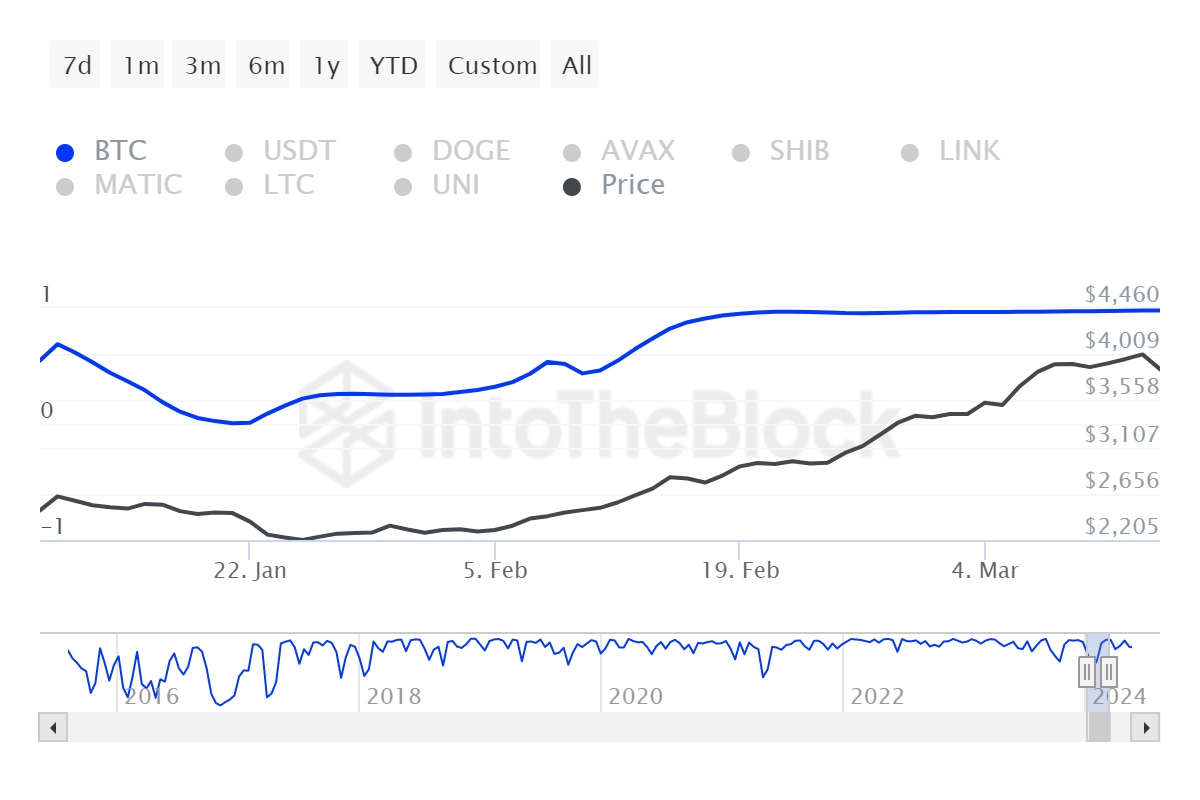
The graph indicates that Ethereum outperforms Bitcoin in bull markets and underperforms in bear markets. While past performance does not guarantee future results, it provides valuable insights for making more informed decisions.
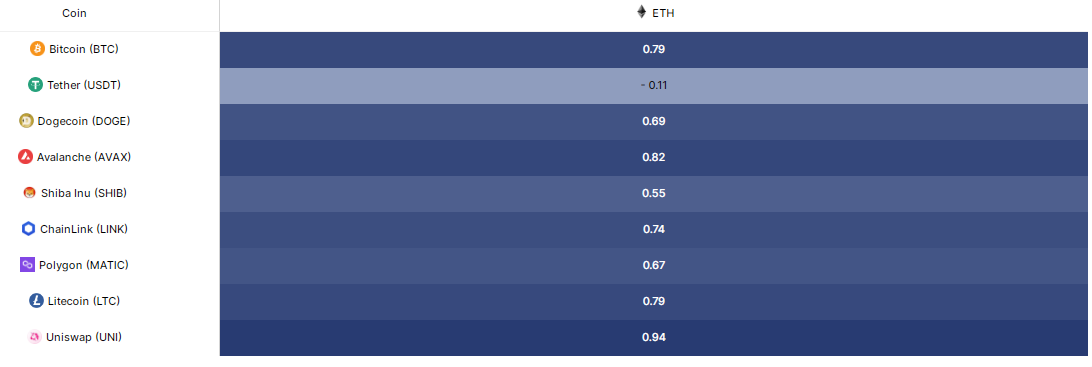
A recent Coinbase report shows that the correlation between Bitcoin (BTC) and Ethereum (ETH) has been declining since early 2023, particularly after Ethereum's Shanghai (Shapella) hard fork on April 12, which enabled staked ether withdrawals. This change has reduced the 40-day rolling correlation from 0.95 to 0.82.
Historically, BTC and ETH have moved together, but factors such as the rising adoption of Ethereum-based decentralized applications (dApps), the popularity of non-fungible tokens (NFTs) and Ethereum's shift to a proof-of-stake (PoS) consensus mechanism are driving the divergence.
Ethereum ETFs expectations
According to IntoTheBlock's research, 95% of current ETH positions are now profitable, with its price increasing by 30% over the past seven days. This level of profitability has not been observed since November 2021, when ETH prices soared to an all-time high.
There is minimal resistance to the volume of ETH purchased at prices higher than current levels. Specifically, 3.57 million ETH were bought in the price range of $3,800 to $4,800, compared to 53.54 million ETH purchased between $2,160 and $2,650.
ETH whales have also begun to make significant moves, following the increased odds of ETF approval. On Tuesday the 21st, ETH recorded an on-chain trading volume of $15.98 billion, marking the highest volume recorded since June 13, 2022.
Of the $15.98 billion in trading volume recorded, $14.33 billion came from transactions exceeding $100,000, typically conducted by whales. This represents 90% of the total traded volume for this day. This trend could be expected to accelerate now that the ETFs have indeed been approved.
The approval of the ETH ETFs marks a significant milestone in cryptocurrency acceptance, likely influencing increased activity among ETH whales as reflected by recent large-volume transactions. The shifting landscape, underscored by substantial on-chain trading volumes, suggests a growing institutional and investor confidence in Ethereum.
 Dan Burgin
 U.Today Editorial Team