Disclaimer: The opinions expressed by our writers are their own and do not represent the views of U.Today. The financial and market information provided on U.Today is intended for informational purposes only. U.Today is not liable for any financial losses incurred while trading cryptocurrencies. Conduct your own research by contacting financial experts before making any investment decisions. We believe that all content is accurate as of the date of publication, but certain offers mentioned may no longer be available.
XRP witnessed its most brutal price drop in years, plummeting by 20% in two days. Typically, XRP is characterized by low volatility, the magnitude of this plunge was particularly catastrophic.
This sharp decline pushed XRP's value down, breaching several crucial support levels. The fall was abrupt, slicing through the anticipated support near the $0.58 mark with ease, and coming to rest just above the $0.48 level.
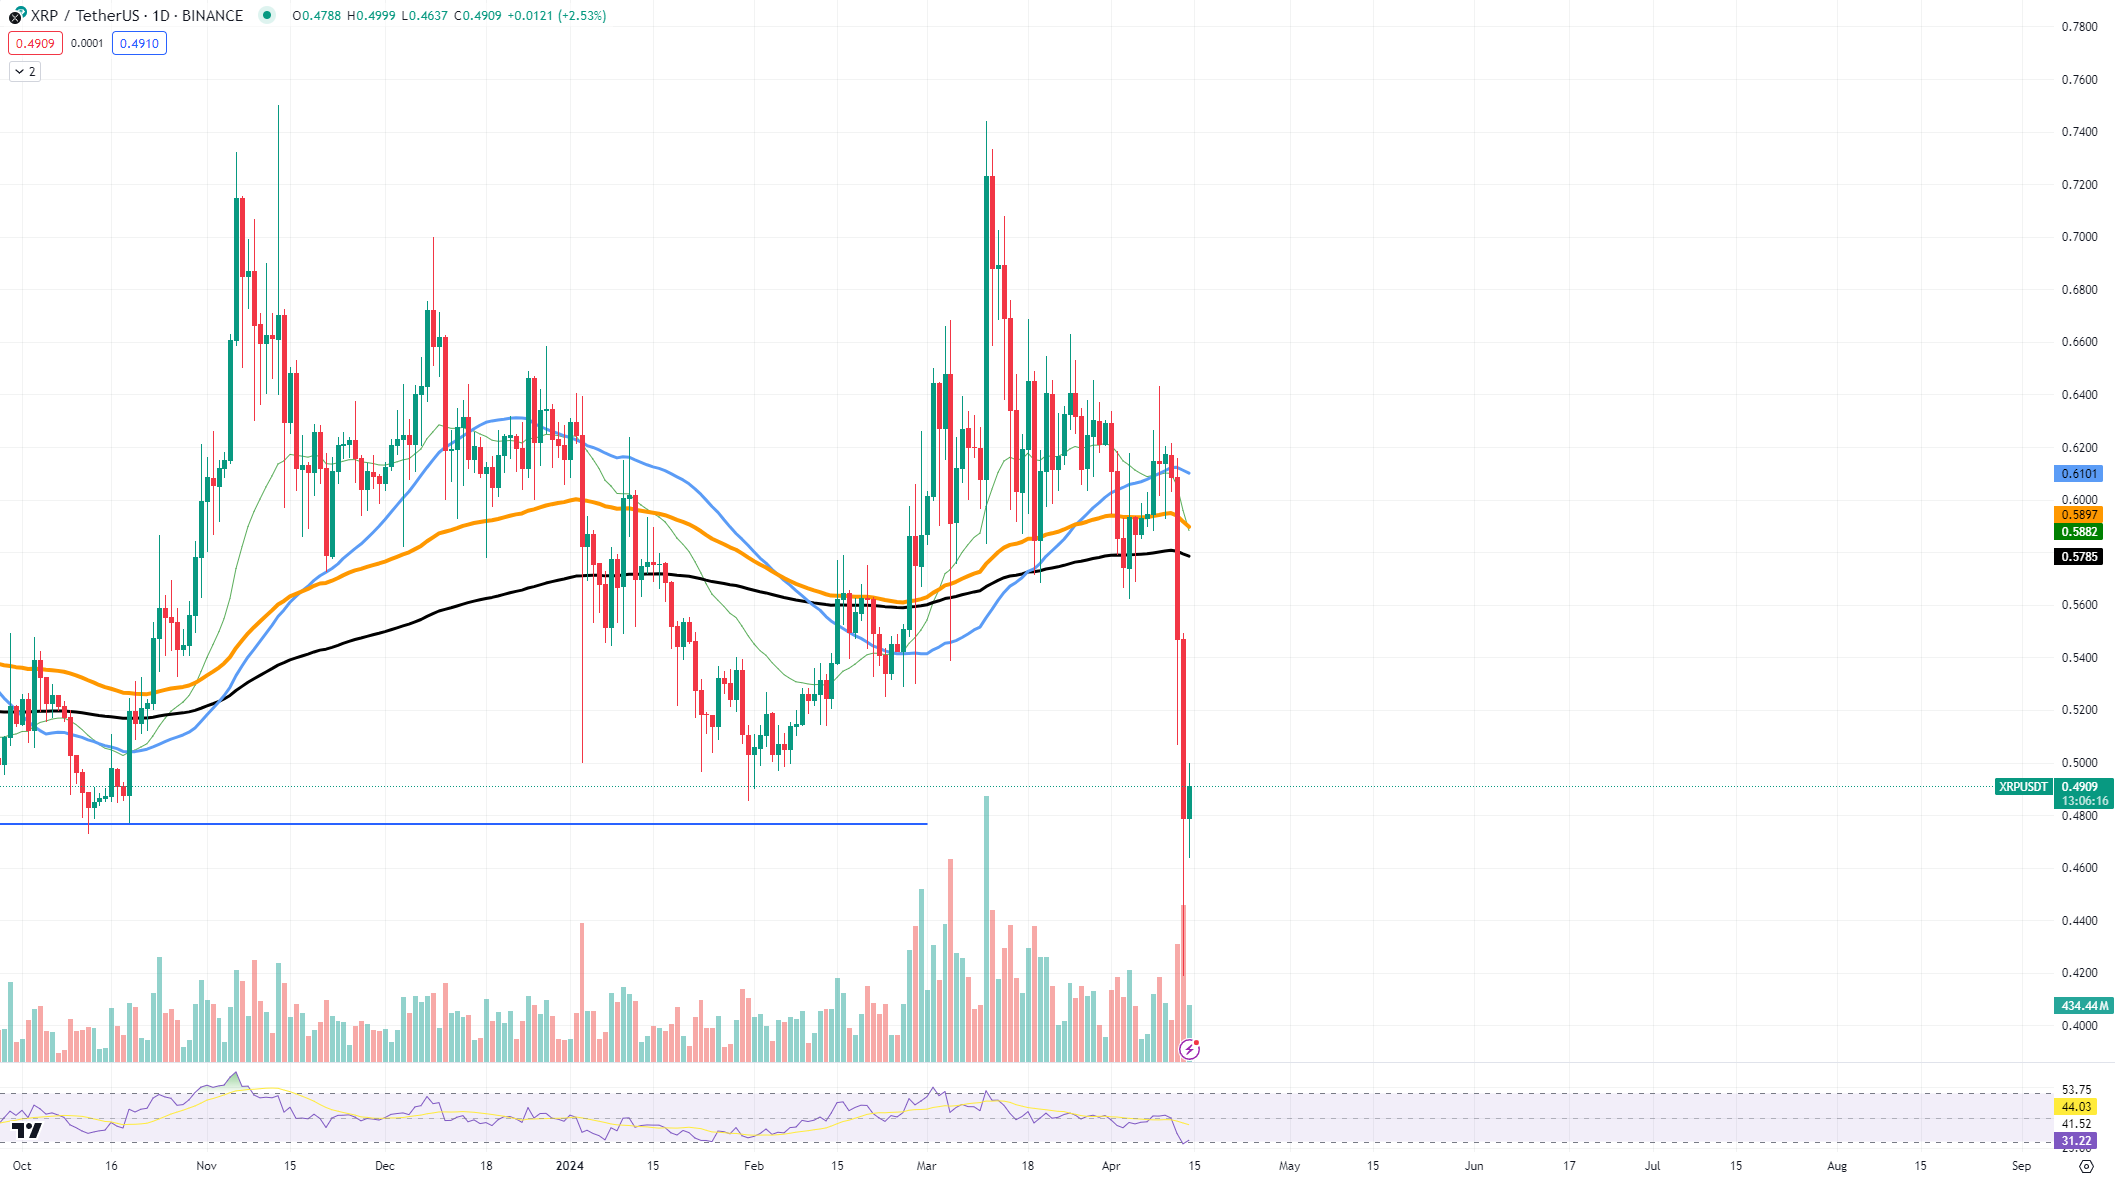
Our main focus now turns to the asset's next technical support levels. The 200-day EMA stands out as a potential bounce point, roughly at the $0.57 mark, slightly above where the plunge halted. Should XRP stabilize and recover above this line, it could instill a semblance of confidence back into the market.
Despite the shock, growth scenarios remain on the horizon. For a bullish reversal to gain credibility, XRP would need to reclaim its position above the resistance formed near the $0.58 level. But considering the current state of the market, that goal seems surreal.
Ethereum on verge
Ethereum is teetering on the edge, with its price just above $3,050 after a significant drop. This precarious position has the crypto community asking: Is Ethereum about to dip below the symbolic $3,000 mark?
The recent price trajectory has not been kind to Ethereum, as the 100-day exponential moving average (EMA), currently near the $3,050 level, is being tested. This average has often provided some buoyancy, but its strength as a support level is not ironclad. Should Ethereum fail to maintain this level, a drop below $3,000 seems increasingly plausible.

However, it is worth considering the potential for a reversal. The start of a new week could see market dynamics shift as investors look to capitalize on what they perceive as bargain prices. This buying pressure at local lows has the potential to reverse the downtrend, at least temporarily.
From a chart perspective, if Ethereum holds its ground above the $3,050 support, there is room for cautious optimism. A rebound from this level could push prices back toward the resistance at $3,400. This would indicate a resurgence of buying interest and could help avert a more substantial decline.
If Ethereum breaks below the $3,000 threshold, the next significant level of support rests at the 200-day EMA, which is around $2,695. A slip to this lower boundary could mark a more pronounced bearish phase for Ethereum.
Looking ahead, the key for Ethereum is whether it can summon the strength to defend the $3,000 level. If it does, and particularly if it can then surge past the 100 EMA, the narrative might shift back to a positive one.
Bitcoin fails
Bitcoin has surprised us all with the substantial price drop that now makes the majority of market participants worry about the future of this bullish cycle.
The drop to levels around $64,300 may signal a trend reversal, marking the end of the recent bull run.

Despite the recent dip, Bitcoin has not completely left its support levels. The 50-day moving average currently sits near $58,417, offering a glimmer of hope as a potential bounce-back point. If Bitcoin can stabilize and hold above this MA, a reversal remains a possibility.
A deeper look at the chart suggests that the $64,300 drop could open up a scenario where Bitcoin tests the next support level, which is the 100-day MA near $60,000. Holding above this could be crucial for maintaining a bullish outlook. If it does, and investor confidence remains steady, there is a chance for Bitcoin to recover and aim for resistance levels once again, possibly around $67,500, where it recently faced pushback.
 Dan Burgin
 U.Today Editorial Team