
Disclaimer: The opinions expressed by our writers are their own and do not represent the views of U.Today. The financial and market information provided on U.Today is intended for informational purposes only. U.Today is not liable for any financial losses incurred while trading cryptocurrencies. Conduct your own research by contacting financial experts before making any investment decisions. We believe that all content is accurate as of the date of publication, but certain offers mentioned may no longer be available.
An important Bitcoin chart that Raoul Pal first shared was recently shared by well-known cryptocurrency trader Peter Brandt. The relationship between the price of Bitcoin and the global M2 money supply is depicted in this chart, which provides insight into the ways in which macroeconomic variables — particularly liquidity — affect the cryptocurrency's performance.
Charts indicate that the price of Bitcoin has generally followed, albeit slightly behind the expansion of the global money supply, or M2. This connection implies that general market liquidity conditions have a significant impact on the value of Bitcoin. When the global money circulation increases, it leads to a rise in demand for Bitcoin, which drives up prices. Deeper research by Raoul Pal reveals a similar pattern with the GMI Total Liquidity Index, another indicator of global liquidity in addition to the correlation between Bitcoin and M2.
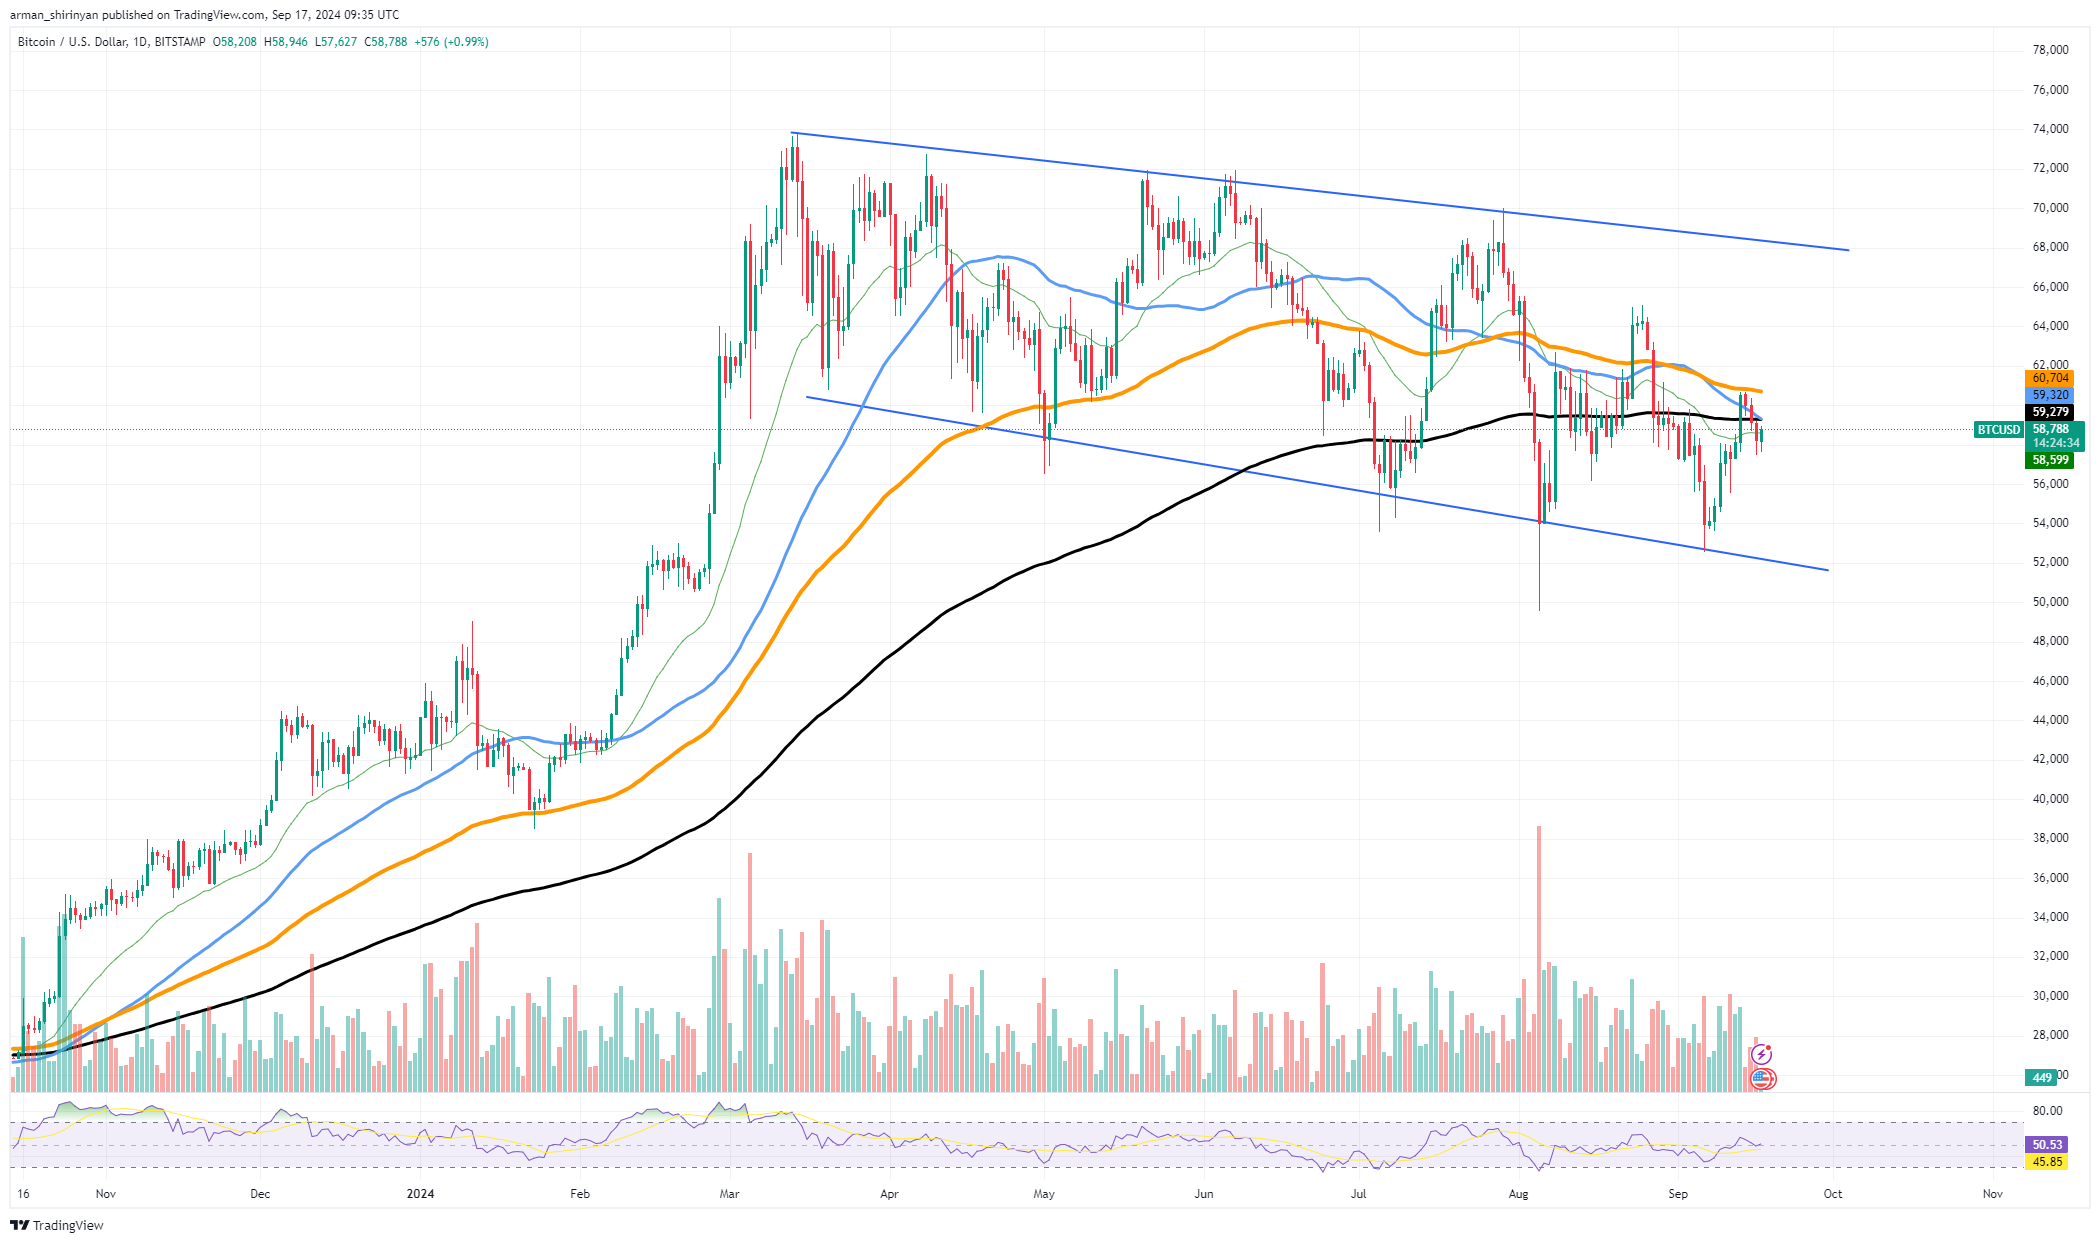
Both charts show that Bitcoin typically rises when liquidity increases. Pal anticipates more gains in M2 and liquidity, which will contribute to a bullish prediction for Bitcoin through the end of 2024. Bitcoin is presently consolidating within a sizable downward channel, according to Peter Brandt's price chart, which is technical in nature. It appears that resistance is strong near $60,000.

The price has been repeatedly rejected at the upper boundary, which is symbolized by the 200-day EMA. Bitcoin might, however, break above these resistance levels and experience a sizable price rally if global liquidity keeps rising, as indicated by the trends of the M2 and GMI Total Liquidity Index.
Put more simply, as more money enters the world economy, there may be a greater demand for Bitcoin, which would raise its price. This type of macroeconomic-driven analysis demonstrates that forecasting the future movements of Bitcoin requires an understanding of liquidity.
 Dan Burgin
 U.Today Editorial Team