Disclaimer: The opinions expressed by our writers are their own and do not represent the views of U.Today. The financial and market information provided on U.Today is intended for informational purposes only. U.Today is not liable for any financial losses incurred while trading cryptocurrencies. Conduct your own research by contacting financial experts before making any investment decisions. We believe that all content is accurate as of the date of publication, but certain offers mentioned may no longer be available.
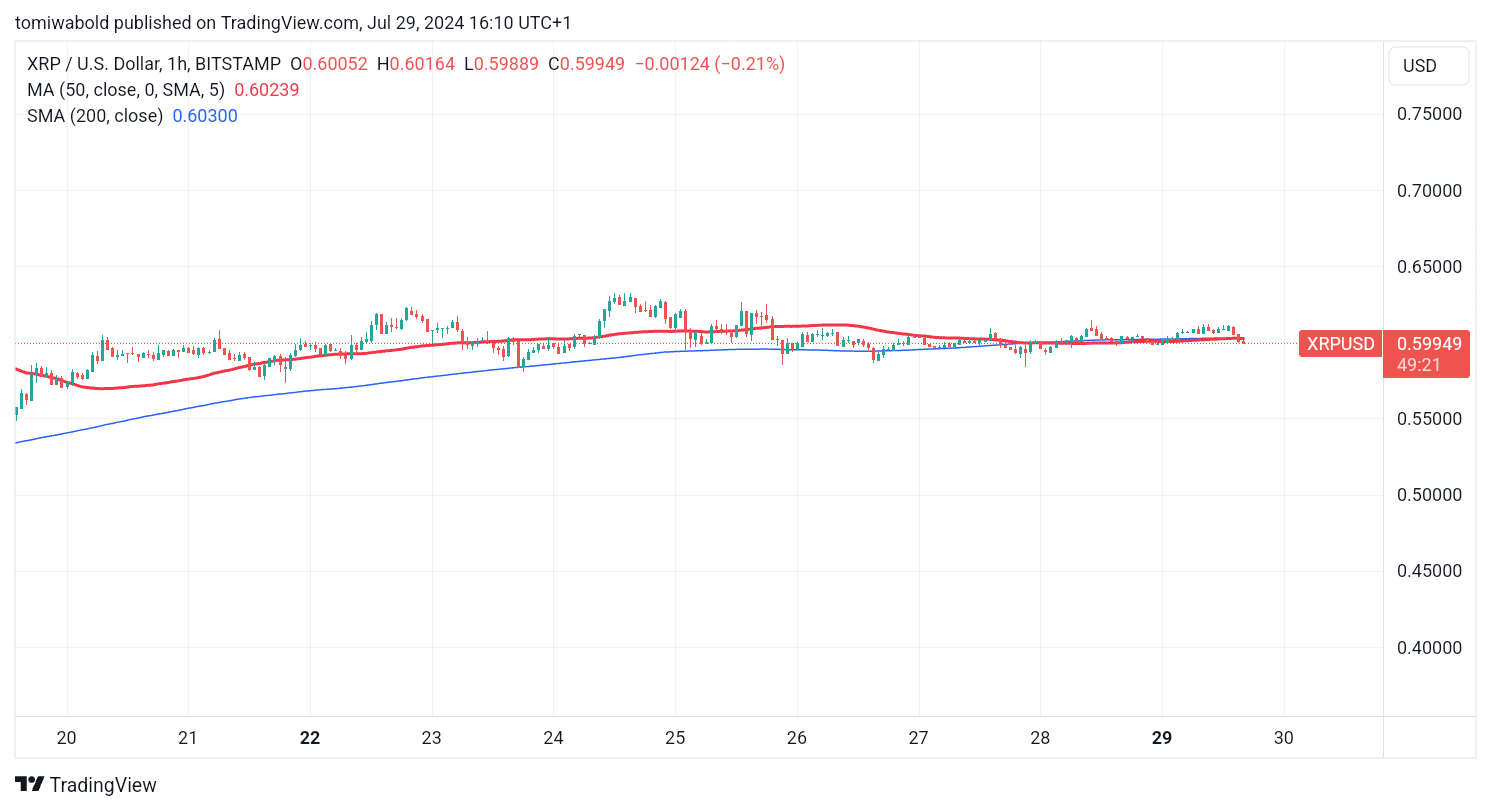
Eyes are currently on XRP, the sixth-largest cryptocurrency by market capitalization, as it awaits a major move - especially considering that the 50 Simple Moving Average (SMA) and the SMA 200 on XRP's hourly chart have converged, setting the stage for a potential crossover. The big question remains whether this will result in a "golden cross" or a "death cross."
A golden cross occurs when a short-term moving average crosses above a long-term moving average, signaling a potential bullish trend. Conversely, a death cross happens when the short-term moving average crosses below the long-term moving average, indicating a potential bearish trend.

The convergence of the 50-hour and 200-hour SMAs suggests that a significant move might be imminent. As these key technical indicators draw closer together, market participants are closely watching for the direction of the crossover to gain insights into XRP's next move.
The fact that XRP recently posted a golden cross on its four-hour chart raises expectations of the nature of the crossover on the hourly charts.
What's next for XRP's price?
XRP has consolidated in a range since hitting highs of $0.6378 on July 17. The range currently has support at $0.542, which coincides with the daily SMA 200.
At the time of writing, XRP was up 0.63% in the last 24 hours to $0.603. If the XRP price returns above $0.61, the bulls might try to push it to $0.64. A move above $0.64 could kickstart a fresh bullish uptrend to $0.74. This level might prompt selling by the bears.
On the contrary, if the XRP price falls below the daily moving averages, the bears might try to push XRP to the support at $0.40. The next major move is expected to start on a break above $0.64 or below $0.54.
In the days ahead, the direction of the moving averages might be crucial to consider. Already the daily SMA 50 is tilting upwards on the daily chart, however, a potential crossover on the daily charts might come in the weeks or possibly months ahead.


 Gamza Khanzadaev
 Caroline Amosun
 Godfrey Benjamin
 Tomiwabold Olajide