Disclaimer: The opinions expressed by our writers are their own and do not represent the views of U.Today. The financial and market information provided on U.Today is intended for informational purposes only. U.Today is not liable for any financial losses incurred while trading cryptocurrencies. Conduct your own research by contacting financial experts before making any investment decisions. We believe that all content is accurate as of the date of publication, but certain offers mentioned may no longer be available.
Market analysts are closely monitoring the Solana (SOL) price chart for signs of the infamous "Head and Shoulders" (H&S) pattern, often considered a precursor to a bearish downturn. Upon initial inspection, the current chart does not showcase the definitive structure of a typical H&S pattern.
Characterized by three distinct speaks — the left shoulder, the central peak (head), and the right shoulder, separated by valleys (troughs) — an H&S formation is anchored by the "neckline," drawn across the lowest points of the troughs, serving as a pivotal support line. Solana's recent price movement on the Kucoin exchange, however, reveals the absence of this pattern, displaying instead a consistent upward trend punctuated by regular corrections.
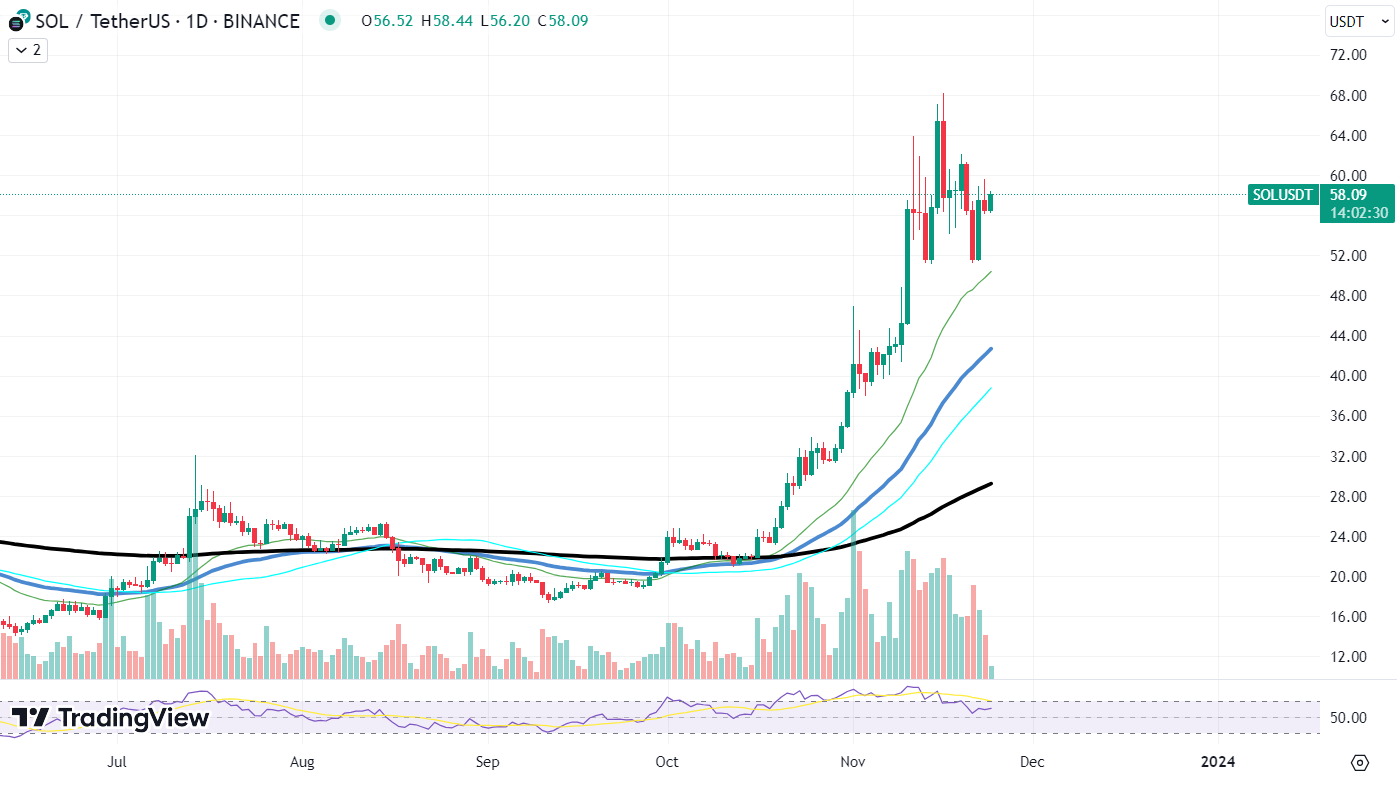
The threat of a trend reversal, nonetheless, casts a long shadow. The future establishment of an H&S pattern on the Solana chart would mark a significant change from a bullish to a bearish market outlook. The formation's completion, with the right shoulder's appearance, would indicate a weakening in the buying force, potentially setting the stage for a change in the asset's trajectory.
Wavelike movement of Solana
Delving into Solana's movements with the Elliott Wave theory provides a more detailed perspective. This theory suggests that market prices oscillate in a predictable five-wave sequence, comprising three "motive" waves and two "corrective" waves. The current pattern on Solana's chart may suggest it is at the end of such a sequence, with the final "motive" wave possibly reaching its peak recently. What follows could be a corrective pattern, which might be misinterpreted as an H&S formation.

The full formation of an H&S pattern would carry weighty consequences for Solana's position on the market. A drop beneath the neckline would validate the bearish pattern, potentially initiating a wave of sell-offs as market participants rush to minimize losses or profit from the downward movement. Such a scenario would indicate the depletion of the bullish energy that has propelled SOL to its current levels, potentially leading to a new bearish cycle.
 Dan Burgin
 U.Today Editorial Team