
Disclaimer: The opinions expressed by our writers are their own and do not represent the views of U.Today. The financial and market information provided on U.Today is intended for informational purposes only. U.Today is not liable for any financial losses incurred while trading cryptocurrencies. Conduct your own research by contacting financial experts before making any investment decisions. We believe that all content is accurate as of the date of publication, but certain offers mentioned may no longer be available.
Recent charts suggest that Shiba Inu (SHIB), one of the most popular meme coins, may be forming a hidden variation of the head and shoulders pattern, providing crucial clues about its future price movement.
The H&S pattern typically consists of a left shoulder, a head and a right shoulder, resembling a human silhouette. It is often interpreted as a bearish signal, indicating that the asset's price may drop after the formation is complete. However, in the case of Shiba Inu, the pattern appears tilted or "hidden," which could mean a less predictable outcome.
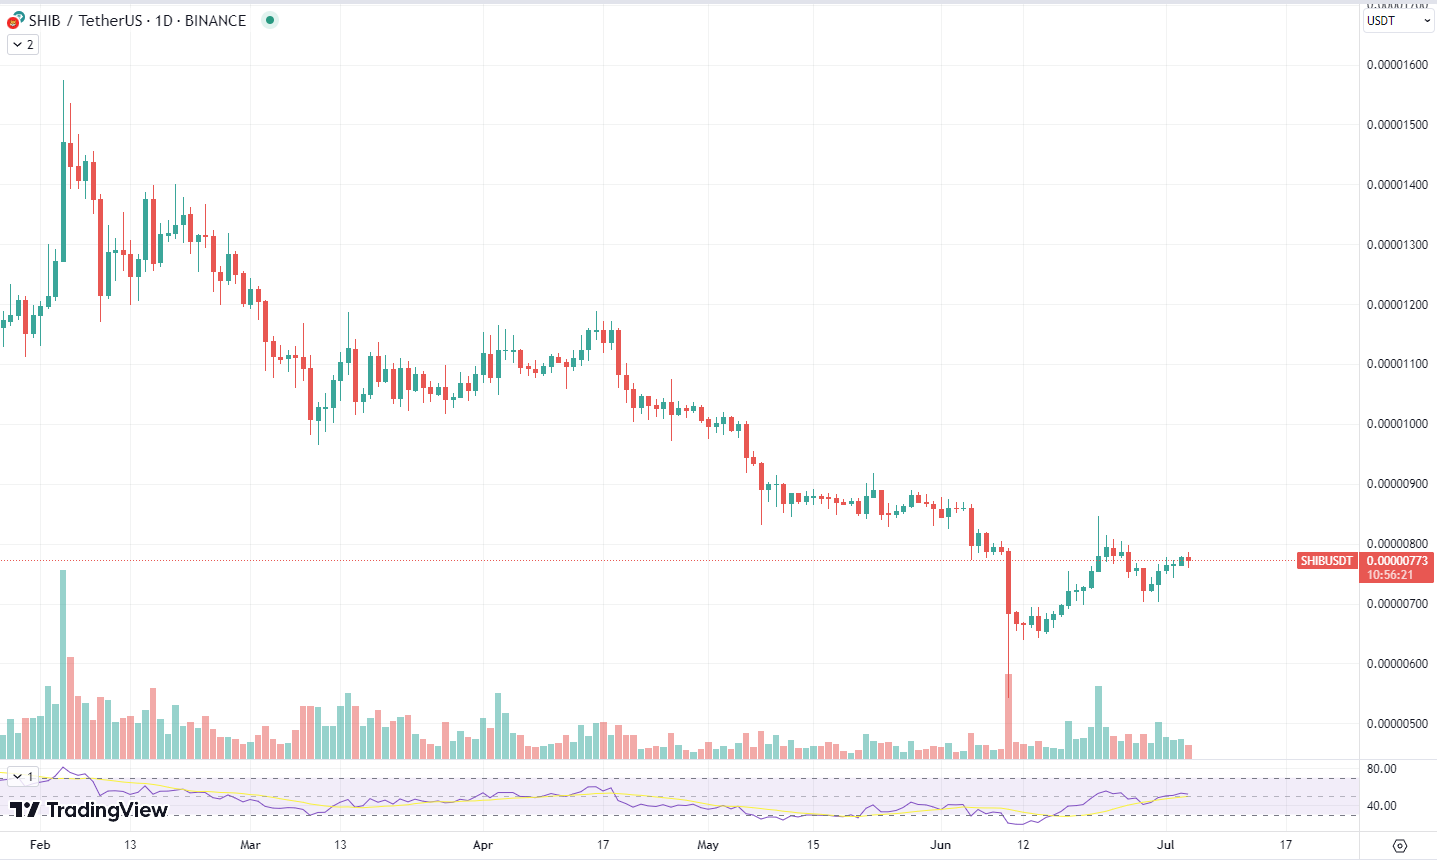
Over the past few weeks, Shiba Inu has been traversing a rocky path, with its price seeing numerous ups and downs. Amid this turbulence, the coin has been navigating through significant resistance, struggling to break free from its local bottom. Yet, the emergence of this hidden H&S pattern may signal a potential shift in market sentiment.
A key factor to monitor in this context is trading volume. In line with the broader market trend, the Shiba Inu volume has been on a steady decline, suggesting a lack of buying pressure. This decrease in volume, coupled with the formation of the H&S pattern, might hint at a critical juncture in Shiba Inu's price trajectory.
However, it is crucial to remember that while patterns like H&S can provide valuable insights, they do not guarantee a certain outcome. Many other factors, including market sentiment, broader economic factors and investor behavior, play a significant role in shaping an asset's price.
PEPE whales are moving
The meme coin market has been undergoing intense volatility, and the PEPE token has not been immune. Recently, a substantial sell-off of billions of PEPE tokens has sparked interest in how the market has reacted.
Intriguingly, prior to the sell-off, there was a noticeable trend of investors actively depositing PEPE on centralized exchanges. Such a move often signifies an intent to sell, as investors move their assets onto an exchange to take advantage of a potential price surge. However, a recent shift has seen investors withdrawing PEPE, leading to speculation that they may either be bolstering existing positions or buying more tokens.

The market response to this intense trading activity has been dynamic. Following a remarkable rise of nearly 15%, the price of PEPE experienced a correction, dropping by 5%. This change is reflective of the fickle nature of the meme coin market, which is often driven by social sentiment and can shift rapidly in response to significant trading movements.
The simultaneous rise and subsequent correction illustrate the inherent risks and opportunities on the meme coin market. While the surge offers an enticing prospect for quick gains, the sharp drop that followed serves as a reminder of the possible pitfalls. Given the notoriously unpredictable nature of meme tokens like PEPE, traders must navigate these waters with caution.
Cardano is aiming for breakout
Cardano (ADA), the well-established smart contract platform, is making another attempt to break through the psychological resistance level of $0.3. However, decreasing volume and a lack of bullish momentum suggest that this effort might fall short.
The $0.3 level has proven to be a tough nut to crack for Cardano. It has attempted to surpass this threshold three times in recent weeks, only to be met with strong resistance each time. The current attempt marks the fourth, and if unsuccessful, it could signal a concerning trend for ADA's price momentum.
One of the key factors to consider in a breakout attempt is trading volume. Higher trading volume during upward price movement typically signifies a strong buyers' market, increasing the chances of a successful breakout. Unfortunately for Cardano, the trading volume has been on a steady decline, suggesting a lack of buying pressure to push the price above the resistance.
Cardano's current market situation presents a classic case of technical analysis. When an asset fails to break a significant resistance level multiple times, it is usually an indication of strong selling pressure or a lack of buyer interest at that price level.
 Dan Burgin