Disclaimer: The opinions expressed by our writers are their own and do not represent the views of U.Today. The financial and market information provided on U.Today is intended for informational purposes only. U.Today is not liable for any financial losses incurred while trading cryptocurrencies. Conduct your own research by contacting financial experts before making any investment decisions. We believe that all content is accurate as of the date of publication, but certain offers mentioned may no longer be available.
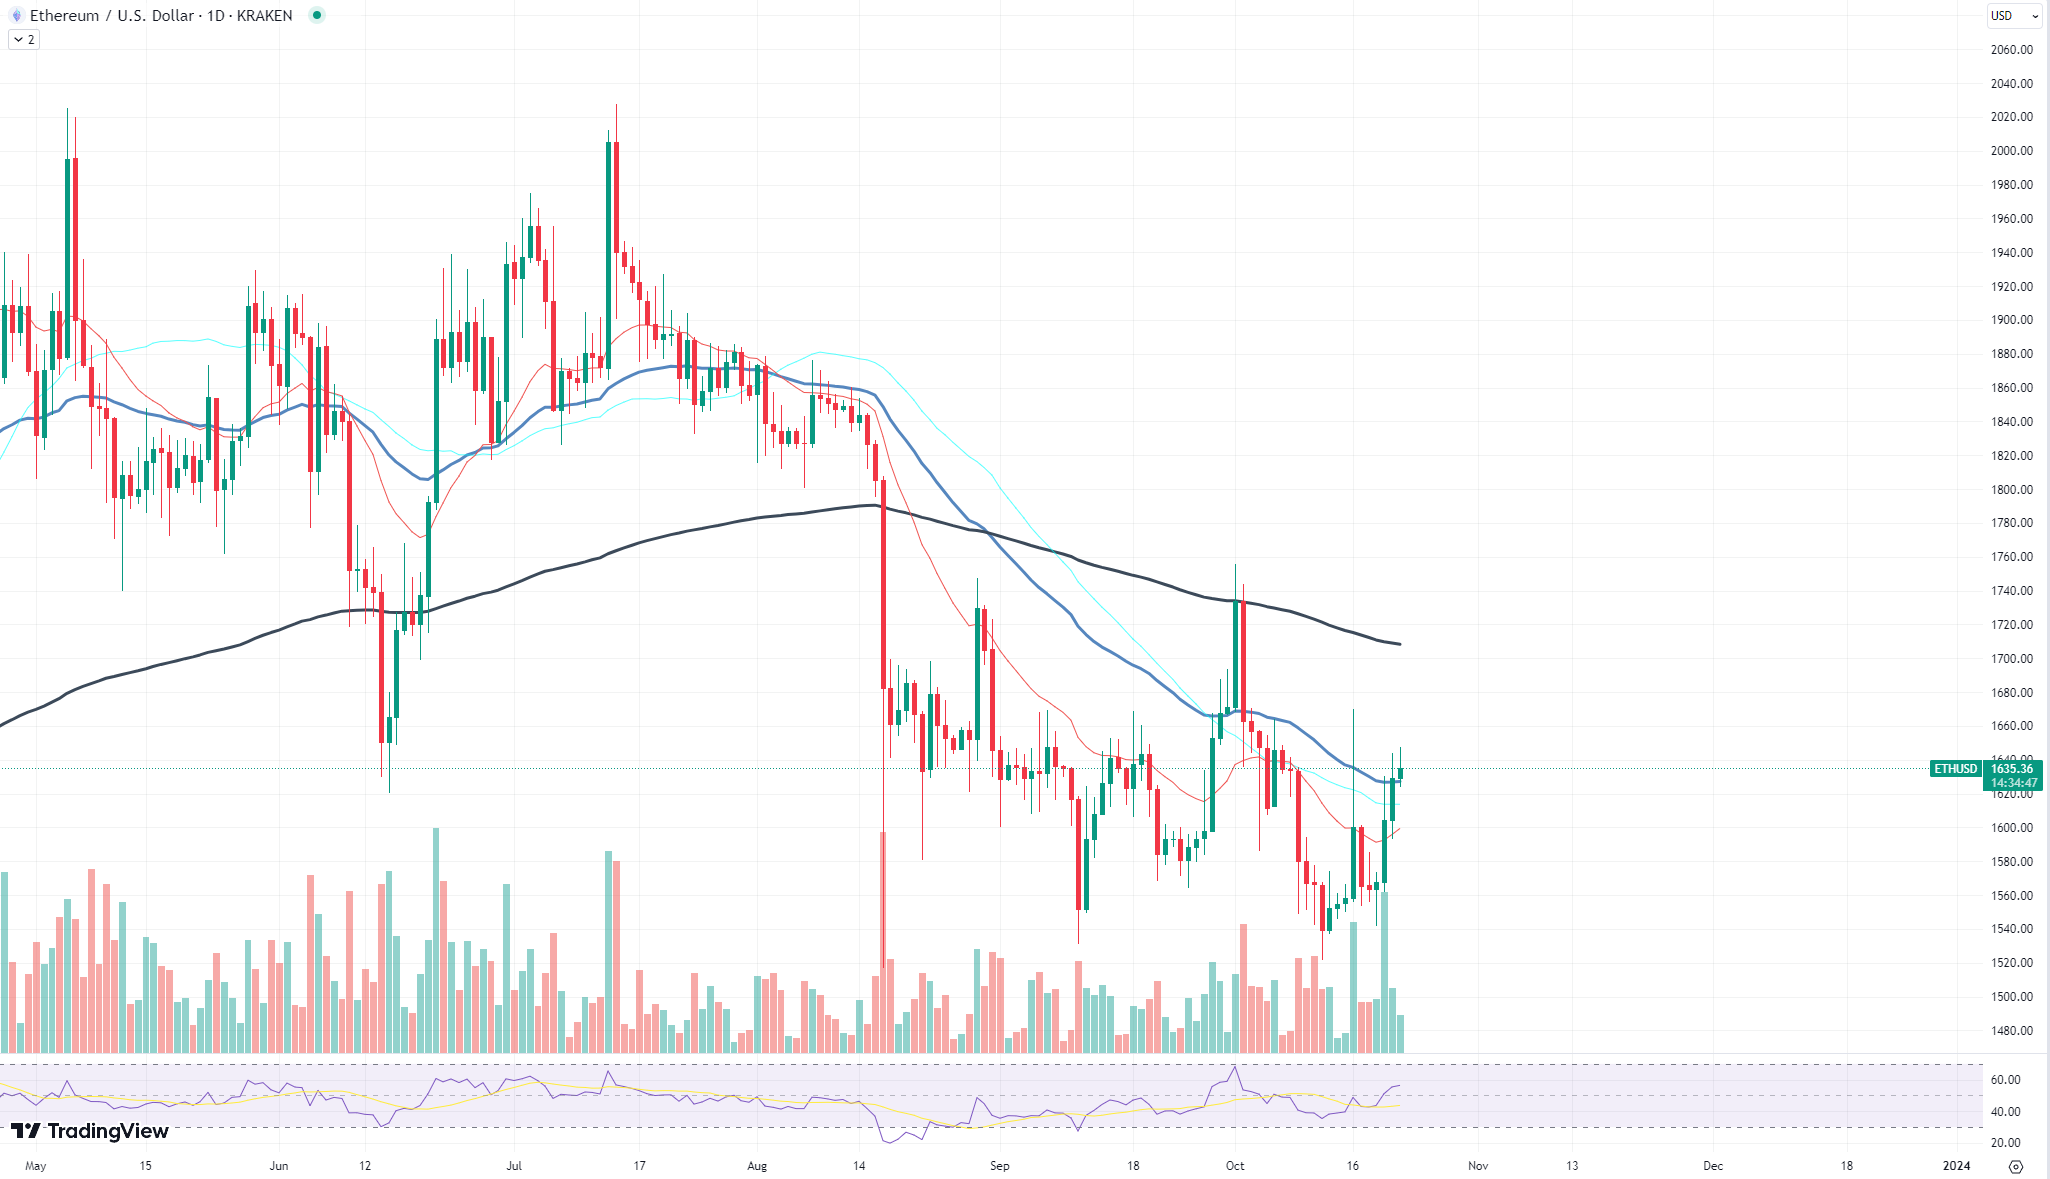
Ethereum has been facing its share of hurdles in the recent market trends. An examination of its daily chart indicates a pivotal juncture at which Ethereum currently finds itself.
First and foremost, a glance at the chart reveals a potential resistance level that Ethereum seems to struggle with. This is evident from the multiple touchpoints that gravitate toward this price ceiling. Historically, consistent inability to break through such resistance has often led to sharp retraces. For Ethereum, the implications could be more pronounced, given the other market dynamics currently in play.

One concerning trend is Ethereum's low network activity. Despite being a hub for countless decentralized apps, the recent lull in on-chain operations signals waning interest or, perhaps, a temporary shift of focus toward newer blockchain platforms. A thriving network is not just about transactions — it is also about development, upgrades and new projects. Low network activity might hint at a pause in these endeavors.
Moreover, while Ethereum wrestles with its price, competitors like Solana are making substantial gains. With a 34% price increase since its local low, Solana is outpacing Ethereum in the race. This divergence is noteworthy. Ethereum's hegemony in the decentralized space is being tested, and these performance metrics might force investors to reconsider their portfolios.
Solana takes stage
The cryptocurrency market is no stranger to spectacular price movements, and Solana (SOL) has recently been at the center of attention. Experiencing an astounding 34% price surge, SOL is definitely not staying on the sidelines. But with such rapid appreciation, investors and traders are inevitably asking: When might this bullish rally slow down or reverse?
Solana's recent price action can be attributed to a variety of factors. Labeled as going through its "second youth," the digital asset is enjoying tremendous growth in network activity. This vitality and resurgence can be seen as a testament to the resilience and potential of the Solana blockchain.
One key element backing this sentiment is Solana's survival through the FTX crisis. Such events can be a death knell for many other cryptos, but not Solana. Its ability to bounce back and even thrive post-crisis underscores its robustness, making it a formidable player in the crypto arena.
A glance at the Solana price chart indicates a powerful uptrend, characterized by higher highs and higher lows. The recent bullish candles reflect the strong buying interest and momentum. However, as with all significant price surges, there is always the possibility of a pullback or correction.
The chart showcases a potential resistance point, where traders might take profits, leading to a temporary slowdown in the price ascent. Moreover, while the relative strength index (RSI) is not in the overbought territory yet, continued upward movement could push it into that zone, indicating that a potential price correction might be on the horizon.
Cardano remains neutral
Recently, Cardano (ADA) has shown promising signs, primarily by its ability to maintain its position above a crucial technical marker — the 50 exponential moving average (EMA). This development cannot be understated, as it often signifies a crucial pivot in sentiment and price direction.
The 50 EMA serves as a dynamic support or resistance level, depending on where the price stands in relation to it. In Cardano's case, remaining above the 50 EMA can be interpreted as a bullish sign, indicating that recent price averages are higher than the longer-term averages.
Traders and analysts often regard this positioning as an affirmation of an asset's resilience and potential for upward momentum. In layman's terms, it is a line in the sand, one that ADA is currently on the favorable side of.
An observable aspect in the current ADA price chart is the downtrend's gradual flattening. After periods of pronounced decline, this leveling out can often precede a trend reversal. Essentially, it can be seen as the market taking a breather, consolidating and potentially gearing up for the next move.

 Vladislav Sopov
 Dan Burgin