Disclaimer: The opinions expressed by our writers are their own and do not represent the views of U.Today. The financial and market information provided on U.Today is intended for informational purposes only. U.Today is not liable for any financial losses incurred while trading cryptocurrencies. Conduct your own research by contacting financial experts before making any investment decisions. We believe that all content is accurate as of the date of publication, but certain offers mentioned may no longer be available.
What are Bollinger Bands?
Bollinger Bands are a technical analysis tool used to gauge the volatility of assets like stocks. They help traders to identify overbought and oversold conditions based on mean reversion principles.
Bollinger Bands consist of three lines: a middle line that represents the asset's moving average and two outer bands that are positioned a certain distance away from the middle line, typically based on standard deviations. The bands expand and contract based on the asset's volatility.
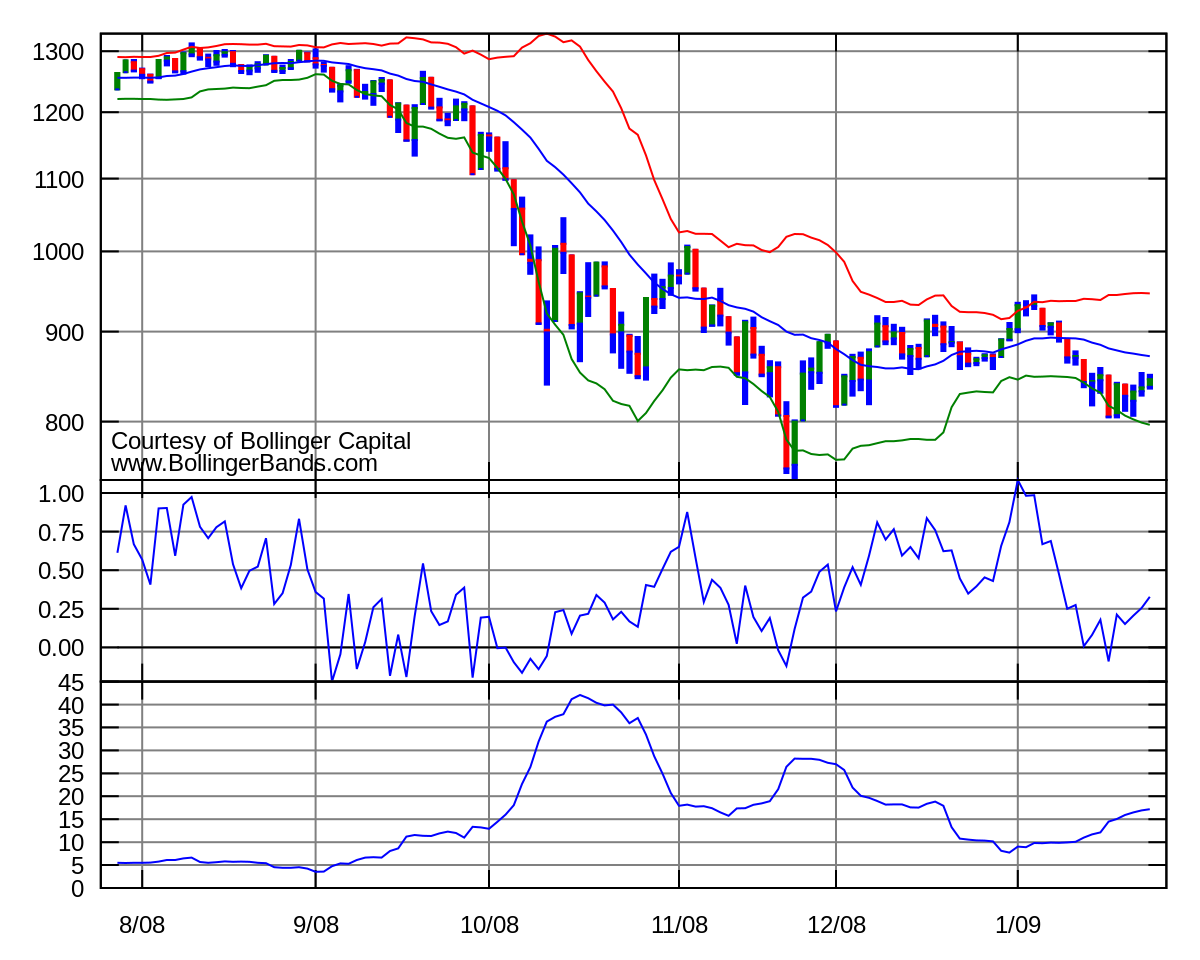
This tool was developed by legendary trader John Bollinger in the 1980s. Bollinger Bands provide insights into market conditions by combining the concepts of a moving average and a volatility measure in one indicator.
As volatility tends to revert to its mean over time, the contraction of the bands often precedes an expansion and a potential price breakout. By monitoring the expanding and contracting bands, traders can anticipate market shifts and improve their trading outcomes.
How do they work?
Bollinger Bands track market volatility, expanding during high volatility and contracting during low volatility. This helps traders identify potential buy or sell signals, such as when the price of the asset moves close to or beyond the outer bands. For instance, here’s Bitcoin Historical Volatility Index chart for 2024:
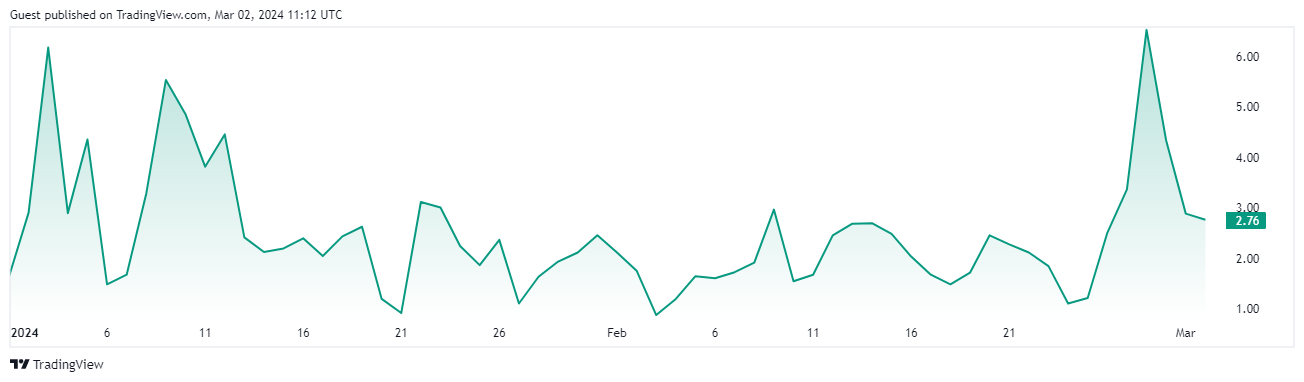
As volatility often reverts to its mean, bands are likely to expand, potentially causing significant price movements. Monitoring these band movements helps traders anticipate breakouts and reversals for more successful trades.
In simple terms, when the price nears the upper band, it is considered overbought and may correct, while near the lower band suggests oversold conditions and a potential rebound. In range-bound markets, traders may buy at the lower band and sell at the upper band.

Upper and lower bands are created by adding and subtracting a multiple of standard deviations (usually two) from the SMA. This forms an envelope around the price series, representing high and low volatility levels. Standard deviation measures price dispersion from the SMA, quantifying volatility. It is typically calculated using the same period as the SMA.
As an example, on Feb. 12, Bollinger highlighted in his post on X the price action of Bitcoin reaching the upper Bollinger Band, signaling a bullish trend.
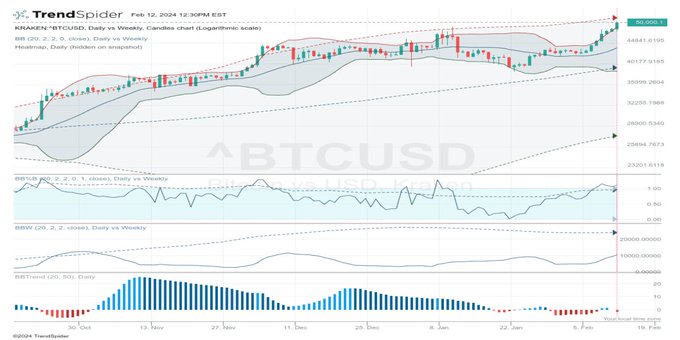
Not only has the price surpassed the upper band, but it has also surpassed the $50,000 threshold, a significant psychological resistance level influenced by human psychology and trading patterns.
Where do you start?
You start by computing the simple moving average (SMA), typically employing a 20-day SMA. The 20-day SMA encompasses averaging the closing prices over the initial 20 days to establish the initial data point.
Subsequently, the standard deviation value is multiplied by two, with the resulting product being both added to and subtracted from each data point along the SMA. This process generates the upper and lower bands, delineating the boundaries of the Bollinger Bands.
Upper band
The upper band within Bollinger Bands marks a price level that sits two standard deviations above the middle band, encompassing roughly 95% of the price action. Acting as a dynamic resistance threshold, it assists traders in pinpointing potential overbought scenarios and determining optimal entry or exit points.

Calculating the upper band involves adding two standard deviations to the 20-day simple moving average (SMA) of the asset's price. This upper band acts as a flexible resistance level, offering guidance to traders on when to open long positions or exit short positions in the market.
Middle band
The middle band, often referred to as the moving average, is determined using a 20-day time frame and acts as a foundational reference point for both the upper and lower bands. Serving as an indicator of the security's average price over the specified period, it facilitates the identification of price trends and potential reversals.
To compute the simple moving average (SMA) for Bollinger Bands, the closing prices across a designated number of periods are averaged. This resultant moving average functions as the middle band within the Bollinger Bands framework, enabling traders to discern prevailing price trends and potential reversal zones in the market.

Lower band
The lower band is two standard deviations below the middle band and helps traders recognize consolidation periods and potential breakout or reversal points. When the upper and lower bands contract, it suggests low volatility and possible breakout opportunities, guiding traders in their buying or selling decisions.
BTC price
As we look at the current BTC/USD chart, we can notice the bands widening at the end of February.
Bollinger Bands tightening during low volatility signal an impending sharp price move, possibly initiating a trend. This is usually referred to as “the squeeze.”
During strong trends, prices may persistently exceed or hug a band. Divergence with a momentum oscillator may prompt further analysis for taking additional profits. A strong trend continuation is expected when the price moves beyond the bands. Immediate retreat back inside suggests weakening strength.
Currently, the market is clear on the uptrend. However, as Bollinger recently pointed out:
Conclusion
Bollinger Bands provide valuable insights into potential price reversals, overbought/oversold conditions and market volatility. However, traders should complement their use with other analytical techniques to make well-informed decisions.
Past price movements depicted in charts do not guarantee future outcomes, and technical analysis alone may not predict market trends accurately. Traders should combine multiple indicators like RSI for more informed decision-making.
 Dan Burgin
 U.Today Editorial Team