
Disclaimer: The opinions expressed by our writers are their own and do not represent the views of U.Today. The financial and market information provided on U.Today is intended for informational purposes only. U.Today is not liable for any financial losses incurred while trading cryptocurrencies. Conduct your own research by contacting financial experts before making any investment decisions. We believe that all content is accurate as of the date of publication, but certain offers mentioned may no longer be available.
Bitcoin's rally to $65,000 ended a long time ago, with the asset swiftly dropping to the range of $45,000. Bitcoin has been continuously moving in the range for the last month, and the low volatility might indicate that the long consolidation is close to being over.
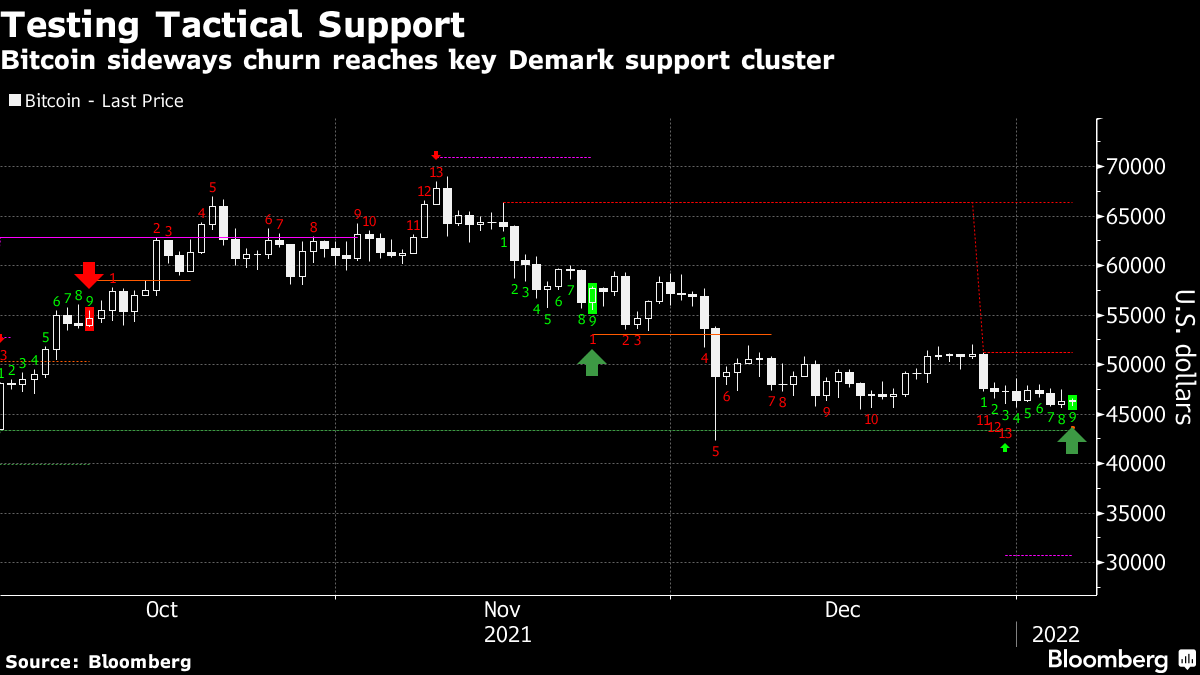
According to Bloomberg's article, the 30-day volatility of the asset is currently moving at its lowest point since September in addition to the price action of the largest cryptocurrency staying negative. As the article suggests, it is "showing short-term exhaustion signals."
Demark Indicator
In order to determine whether the asset's price movement is "exhausted," traders use the Demark Sequential indicator which acts based on the price's history. The indicator is a technical analysis tool, which compares an asset's recent extremes with the previous period's equivalent price.
The methodology allows traders to compare the current demand of the asset with previous periods and determine the directional trend on the market. Some traders compared Demark with the RSI indicator, but the two tools work different, with the RSI counting closing levels only when the abovementioned indicator includes both highs and lows of a specific period.
What does Demark indicator show on Bitcoin?
According to the indicator, Bitcoin has formed a "9-13-9" pattern, which is considered one of the strongest "exhaustion" signals in the technical analysis field. The same pattern appeared back in March 2019, when Bitcoin was trading at approximately $3,800.

At press time, Bitcoin is trading at $46,000 and showing 2% growth. In the last seven days, Bitcoin's price has changed by 0.6%, which is considered extremely low volatility.
 Dan Burgin
 U.Today Editorial Team