
Disclaimer: The opinions expressed by our writers are their own and do not represent the views of U.Today. The financial and market information provided on U.Today is intended for informational purposes only. U.Today is not liable for any financial losses incurred while trading cryptocurrencies. Conduct your own research by contacting financial experts before making any investment decisions. We believe that all content is accurate as of the date of publication, but certain offers mentioned may no longer be available.
Ethereum's price today is showcasing a bullish surge that is drawing attention across the crypto community. Ethereum is a bellwether for the altcoin market, and today's price action suggests that investors are increasingly confident in the asset's value proposition.
The technical chart for Ethereum indicates a strong push toward a key resistance level. After a period of consolidation, the price has broken out, suggesting a potential shift from a bearish to a bullish trend at around $2,100. This move aligns with a broader market recovery.
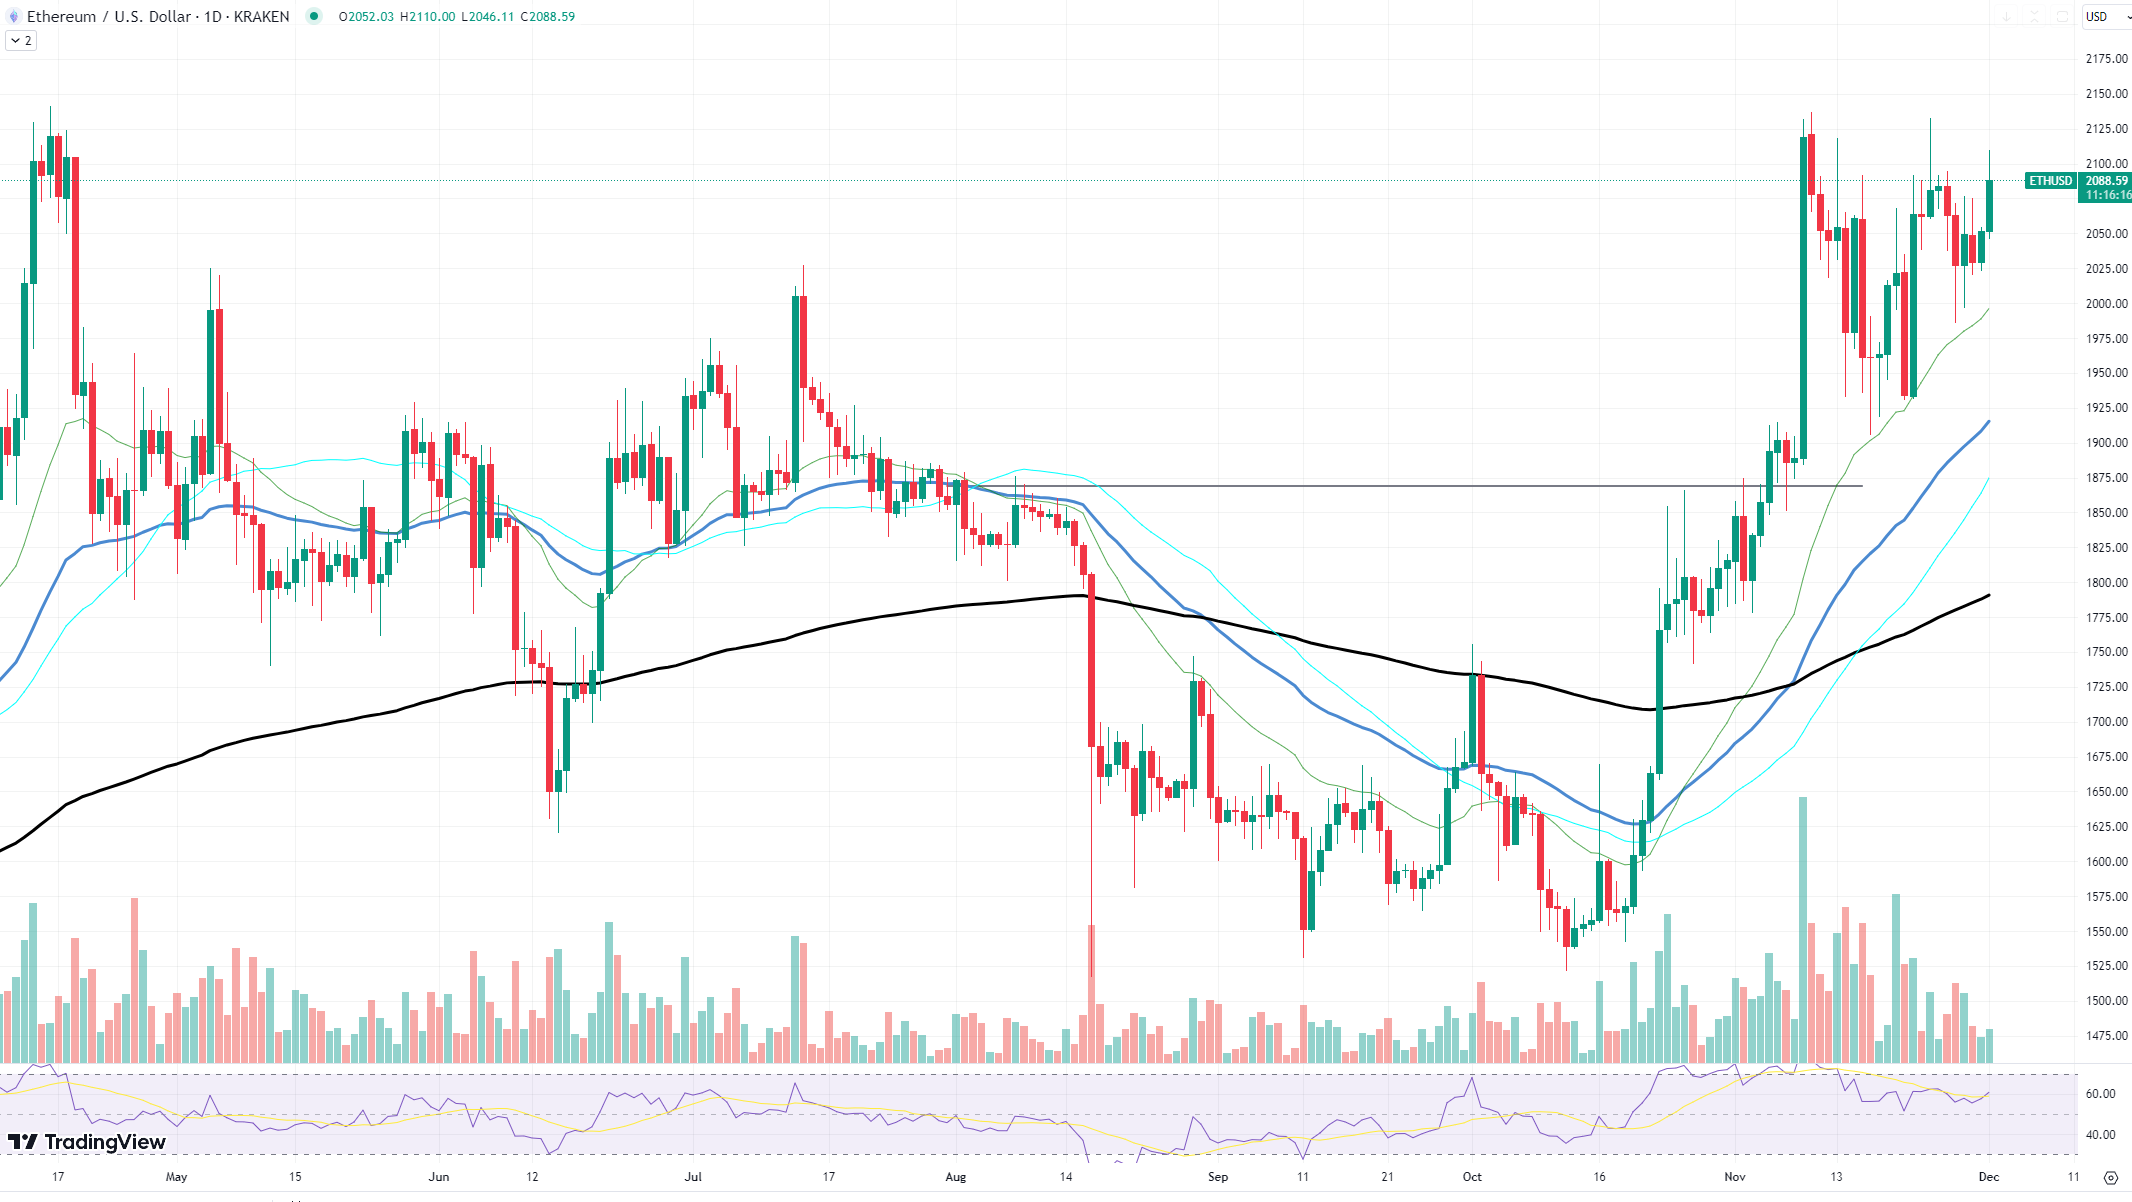
Analyzing the chart, Ethereum has been tracing an ascending trajectory, supported by a rising trendline that underscores a series of higher lows – a classic indicator of bullish sentiment. The 50-day moving average, which is often looked upon for trend confirmation, is positioned below the current price, serving as a dynamic support level. The price is pushing toward the $2,100 level, which has historically acted as a significant resistance zone.
A breakthrough above this resistance could signal the start of a new uptrend, potentially challenging previous highs. However, traders will be watching closely for sustained volume to accompany this price increase, as higher trade volumes would lend credence to the breakout and suggest stronger conviction among buyers.
The Relative Strength Index (RSI), a momentum indicator, is currently hovering in the upper neutral zone, nearing overbought territory. While this could indicate that a pause or pullback is due, it also reflects the strong buying pressure that has driven the recent price increase.
Dogecoin not joking
At the time of writing, Dogecoin's price hovers around $0.38, which has established itself as a significant resistance point. This level has been tested multiple times over recent weeks, with each attempt bringing increased selling pressure. However, the persistence of DOGE bulls is noteworthy, as they continue to push the price back up to this threshold, indicating a potential accumulation phase preceding a breakout.
The technical indicators on the chart reinforce this narrative. The moving averages are aligned in a bullish formation, with the 50-day moving average serving as dynamic support below the current price. This could embolden the bulls, offering a psychological boost as they rally to break past the current resistance.

Furthermore, the formation of a small symmetrical triangle suggests that volatility may be on the horizon for Dogecoin. This pattern, characterized by converging trend lines, points to a period of consolidation that typically precedes significant price movement. Given the positioning of the price at the upper end of the triangle, there is an argument to be made for an impending bullish breakout.
Examining the volume, we see a consistency that accompanies the consolidation pattern, hinting that a breakout could be accompanied by a substantial increase in trade volume. This would provide the necessary market confirmation for a genuine breakthrough, rather than a false breakout that could trap overzealous bulls.
ADA's consolidation continues
The Cardano (ADA) market has entered a phase of consolidation, marked by a confluence of technical indicators that suggest brewing momentum. With the price oscillating around $0.38, the question on many investors' minds is whether this is the quiet before the storm of a significant breakout.
A close examination of the daily chart reveals diverging moving averages, with the 50-day moving average trending upward, suggesting a bullish undercurrent, while the 200-day moving average is moving lower, indicating potential longer-term bearish sentiment. This divergence can often signal a period of market indecision, with shorter-term bullish sentiment wrestling against longer-term caution.
The immediate resistance level for ADA sits at around $0.40, a threshold that has capped upward price movements in recent times. For a confirmed breakout, ADA bulls need to push and sustain the price above this level, ideally with an increase in volume to signify strong market conviction.
 Dan Burgin