Disclaimer: The opinions expressed by our writers are their own and do not represent the views of U.Today. The financial and market information provided on U.Today is intended for informational purposes only. U.Today is not liable for any financial losses incurred while trading cryptocurrencies. Conduct your own research by contacting financial experts before making any investment decisions. We believe that all content is accurate as of the date of publication, but certain offers mentioned may no longer be available.
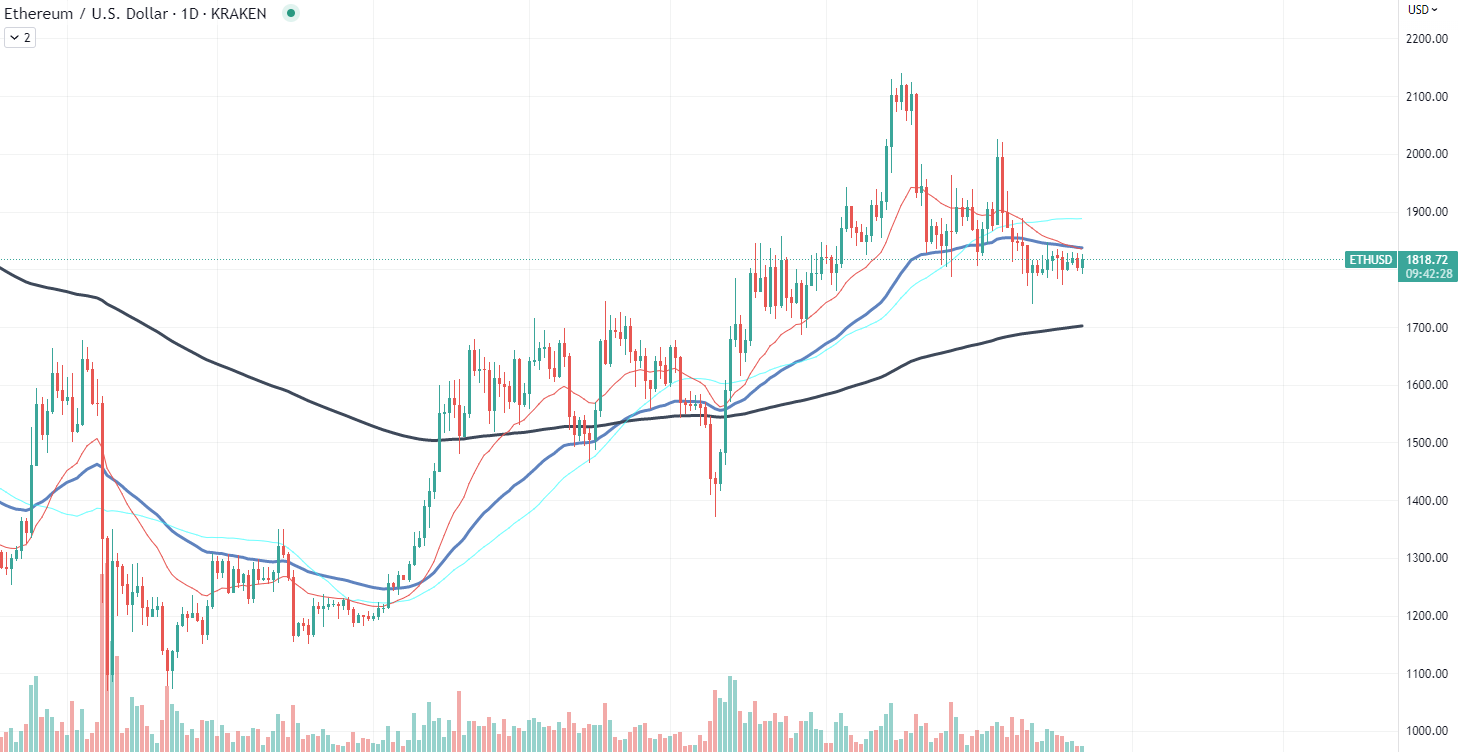
Ethereum (ETH) may be on the brink of a notable trend reversal, as key indicators hint at an imminent bullish turn. After a period of steady decline over the past few weeks, the digital currency is exhibiting signs that point toward a potential upswing, with $1,900 being the primary target.
Over the past several weeks, Ethereum has witnessed a consistent downward trend, leaving investors wary. However, a closer look at the market dynamics reveals emerging patterns that indicate a possible shift in the asset's trajectory. The descending trading volume and decreasing volatility, two significant parameters in trend analysis, suggest that a reversal could be on the horizon.

Trading volume, a crucial indicator of market activity and investor interest, has been on the decline for Ethereum. The reduced trading volume often precedes significant price movements as it indicates a decrease in selling pressure, setting the stage for a potential price spike. For Ethereum, the reduced trading volume appears to be paving the way for a bullish reversal.
Alongside this, Ethereum's volatility, a measure of the rate and magnitude of changes in price, is also decreasing. This decrease could signal that the bearish sentiment is starting to wane and a period of price stability may follow. Decreasing volatility often precedes trend reversals as it reflects investor consensus and a maturing market.
Shiba Inu on reversal path
The meme-inspired cryptocurrency, Shiba Inu (SHIB), appears to have reached its long-term bottom, forming a price zone that it has bounced off from more than three times. This pattern, seen commonly in altcoins and meme assets, could suggest the start of short-term rallies for SHIB.
Initially, like most altcoins, SHIB was listed with negligible volatility. However, a sudden surge in popularity, often dubbed as the "moon phase," rocketed the token's value, garnering the attention of investors worldwide. The extraordinary rise was then followed by a prolonged retracing. The inability to reach its previous all-time high (ATH) was primarily because retail investors who have not already gained SHIB exposure were significantly limited.
Today, SHIB's pattern seems to be painting a different story. The token appears to have reached a solid bottom, a price level it has consistently bounced off of on more than three occasions. This bottoming pattern is a commonly observed phenomenon on many altcoins and meme assets. It generally signifies a strong support level, which, if held, could act as a springboard for subsequent short-term rallies.
This pattern has been observed in numerous other crypto assets as well. After an initial listing phase with limited volatility, there is an unexpected surge (or "moon phase") followed by a long period of retracement. The bottoming phase, however, tends to rejuvenate the market dynamics of the asset, inviting a fresh wave of retail and institutional interest.
Cardano gets second chance
Cardano (ADA) appears to be exhibiting resilience as it touches a crucial support level yet again, underscoring its robust market fundamentals.
Tracing its price movement since March, ADA has now reached its trendline support level for the third time. The first retest of this level occurred in early May, with the second following closely just a few days ago. Despite not showing a significant bounce, ADA has still managed to add approximately 1% to its value.
This ongoing touch of the support level, originally formed back in March, is indicative of ADA's strong fundamental underpinnings. The trendline support level represents the price floor at which the asset's price stops falling and begins to trade sideways or increase. This typically indicates strong buying interest at that price level, underlining the resilience of ADA.
Cardano's ongoing performance sends a clear message to the market — it is not backing down. ADA remains one of the most popular cryptocurrencies, with a vibrant and active community backing its technological developments and applications.

 Yuri Molchan
 Godfrey Benjamin
 Gamza Khanzadaev
 Alex Dovbnya