
Disclaimer: The opinions expressed by our writers are their own and do not represent the views of U.Today. The financial and market information provided on U.Today is intended for informational purposes only. U.Today is not liable for any financial losses incurred while trading cryptocurrencies. Conduct your own research by contacting financial experts before making any investment decisions. We believe that all content is accurate as of the date of publication, but certain offers mentioned may no longer be available.
Ethereum finds itself at a crucial juncture. Currently trading at around $1,576, it is teetering just $26 above the significant support level of approximately $1,552. This particular price point has been a magnet for whale accumulation, making it a critical level to watch.
The trading volume for Ethereum has been on a downward trajectory, which often serves as a precursor to heightened volatility. This declining volume, coupled with the asset's proximity to a key support level, creates a tension-filled atmosphere. Market participants are keenly watching to see if the support will hold or give way to further price depreciation.
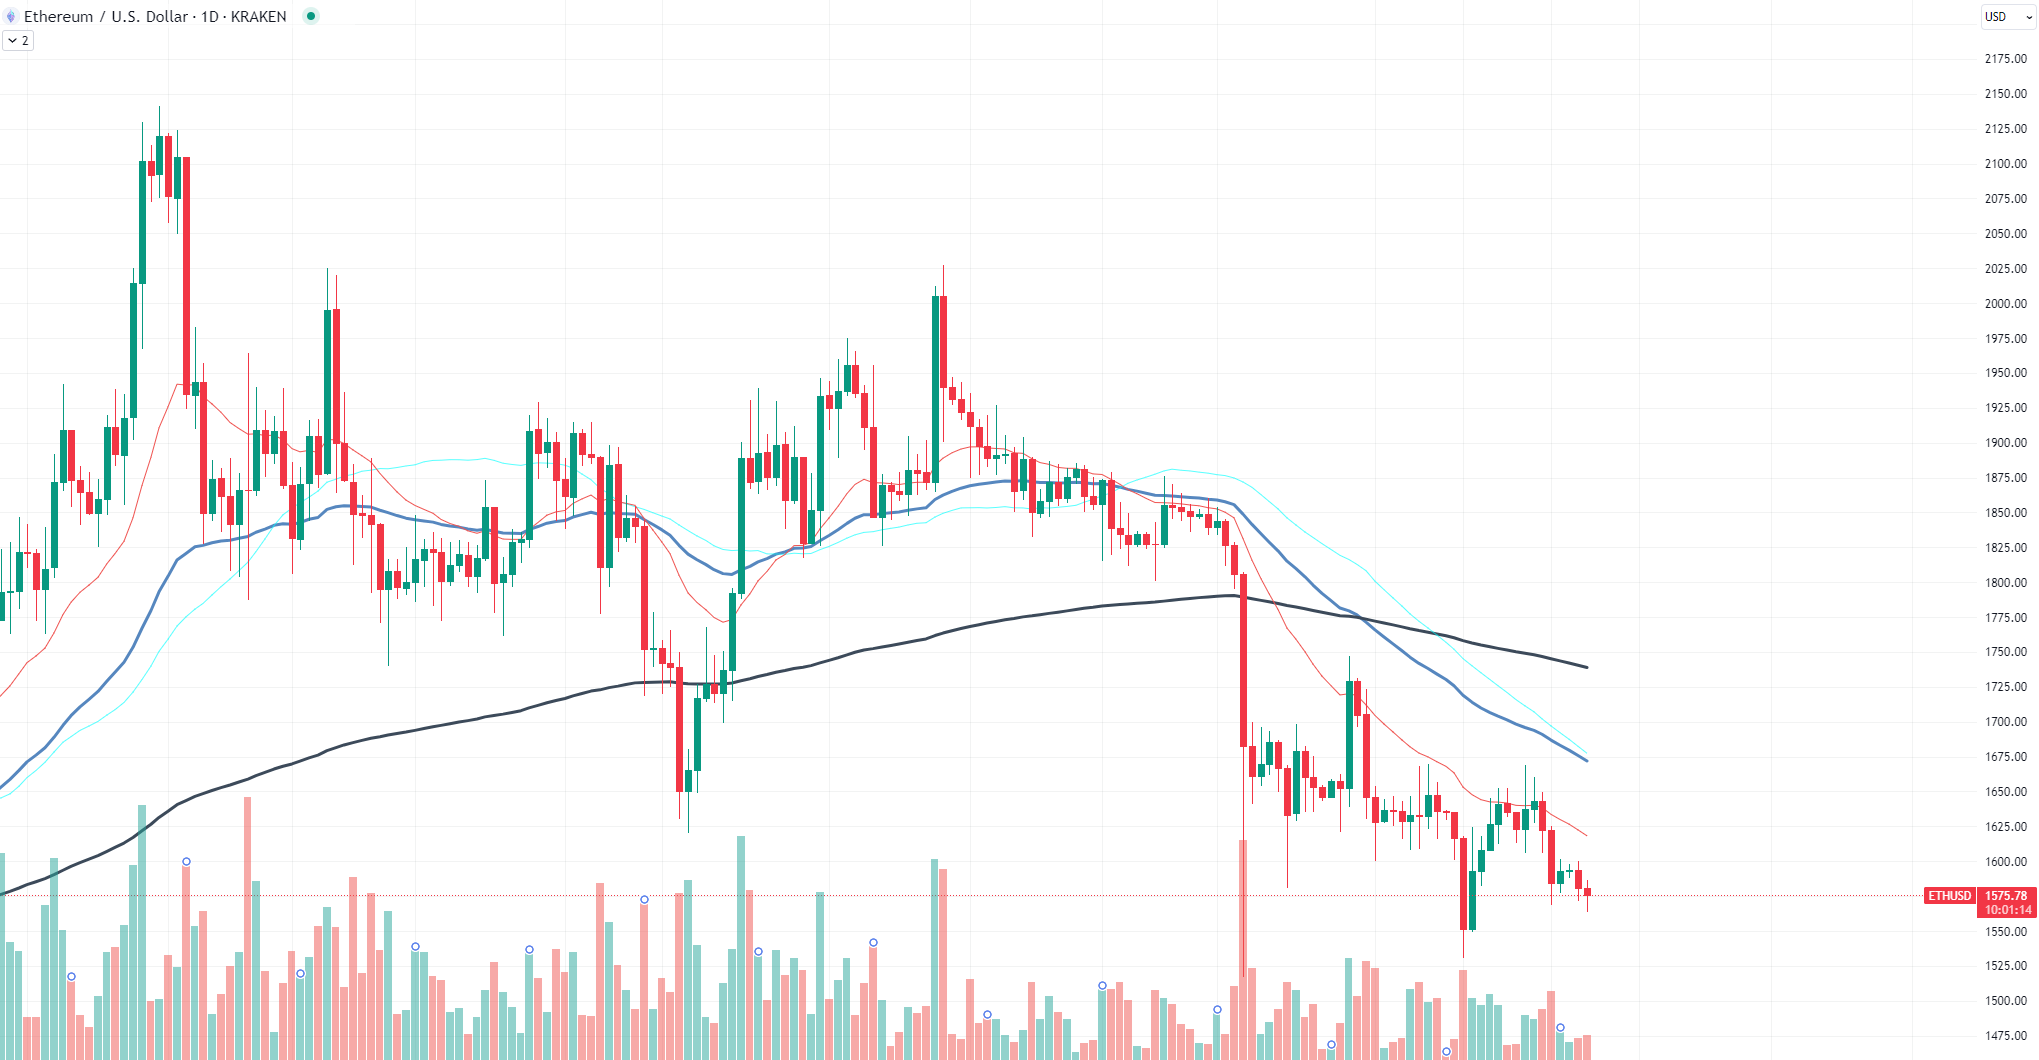
Adding another layer of complexity is the long-ago occurrence of the death cross, a bearish indicator where the 50-day moving average crosses below the 200-day moving average. This technical event often signals a continuation of downward pressure, and in Ethereum's case, it has yet to prove otherwise.
The Ethereum network has been a hotbed of innovation, particularly in the DeFi sector. However, despite its technological advancements, the asset is not immune to market forces. The current technical setup suggests that Ethereum could be in for more downside, unless a significant catalyst alters its course.
In essence, Ethereum is at a crossroads. The confluence of descending trading volume, a critical support level and a lingering death cross creates a complex tapestry of factors that traders and investors must navigate. The asset's next move could very well set the tone for its short to medium-term trajectory.
Cardano meets triangle
Cardano (ADA) finds itself in a precarious position, navigating the narrowing straits of a descending triangle. As ADA approaches the triangle's apex, market participants are bracing for a volatility explosion. Currently, ADA is priced at approximately $0.2447, according to recent data.
The descending triangle is a pattern that often signals a bearish continuation. However, it is crucial to note that the pattern can break either way — up or down. The key is to watch for a decisive move on significant volume. Speaking of volume, ADA's trading activity has been relatively subdued, which often precedes a burst of volatility.

The Cardano network has been a subject of admiration for its focus on rigorous academic research and a peer-reviewed approach to blockchain development. Yet, despite its lofty ideals, Cardano has not been immune to the broader market's lethargy.
The convergence of moving averages further substantiates the notion of impending volatility. When moving averages converge, they often indicate a period of market indecision, a tussle between the bulls and the bears. Once one side gains the upper hand, the asset usually makes a strong move in that direction.
Shiba Inu's unexpected dynamics
A closer look at the Shiba Inu data reveals a surprising twist: SHIB is actually on an upward trajectory. While the longer-term price picture might suggest otherwise, the asset has been subtly climbing, albeit with some volatility.
The current price movement of Shiba Inu hints at a "bearish flag" formation. A bearish flag is generally a continuation pattern that indicates a potential downward breakout. However, it is essential to note that these patterns are not set in stone and can sometimes defy expectations.

A pivotal moment for Shiba Inu came when it faced a strong price rejection at the 21 Exponential Moving Average (EMA), a commonly used technical indicator. This rejection led to a 3% price reversal for SHIB, adding another layer of intrigue to its price action. While a 3% move might not sound groundbreaking, in the high-stakes world of cryptocurrency trading, even small percentage changes can have a significant impact.
What does this all mean for Shiba Inu? The asset finds itself in a complex situation. On one hand, the bearish flag formation and the 21 EMA rejection point toward a potential downside. On the other hand, the asset has been quietly trending upward, defying broader bearish sentiment.
 Dan Burgin
 U.Today Editorial Team