
Disclaimer: The opinions expressed by our writers are their own and do not represent the views of U.Today. The financial and market information provided on U.Today is intended for informational purposes only. U.Today is not liable for any financial losses incurred while trading cryptocurrencies. Conduct your own research by contacting financial experts before making any investment decisions. We believe that all content is accurate as of the date of publication, but certain offers mentioned may no longer be available.
Cardano has been quietly maintaining an uptrend that some investors may not have noticed due to the most recent price correction. While ADA's price movement is currently below the 50-day EMA, a commonly watched technical indicator, a deeper analysis reveals that Cardano is being sustained by what could be considered a hidden trendline support.
This subtle trendline acts as a stealthy undercurrent, guiding ADA's trajectory in a positive direction. Unlike the more apparent signals provided by EMAs, this support level does not jump out on a cursory glance at the charts, requiring a more discerning eye to identify. It is this hidden trendline that seems to be of more critical importance to Cardano's price action than the widely recognized EMA indicators.
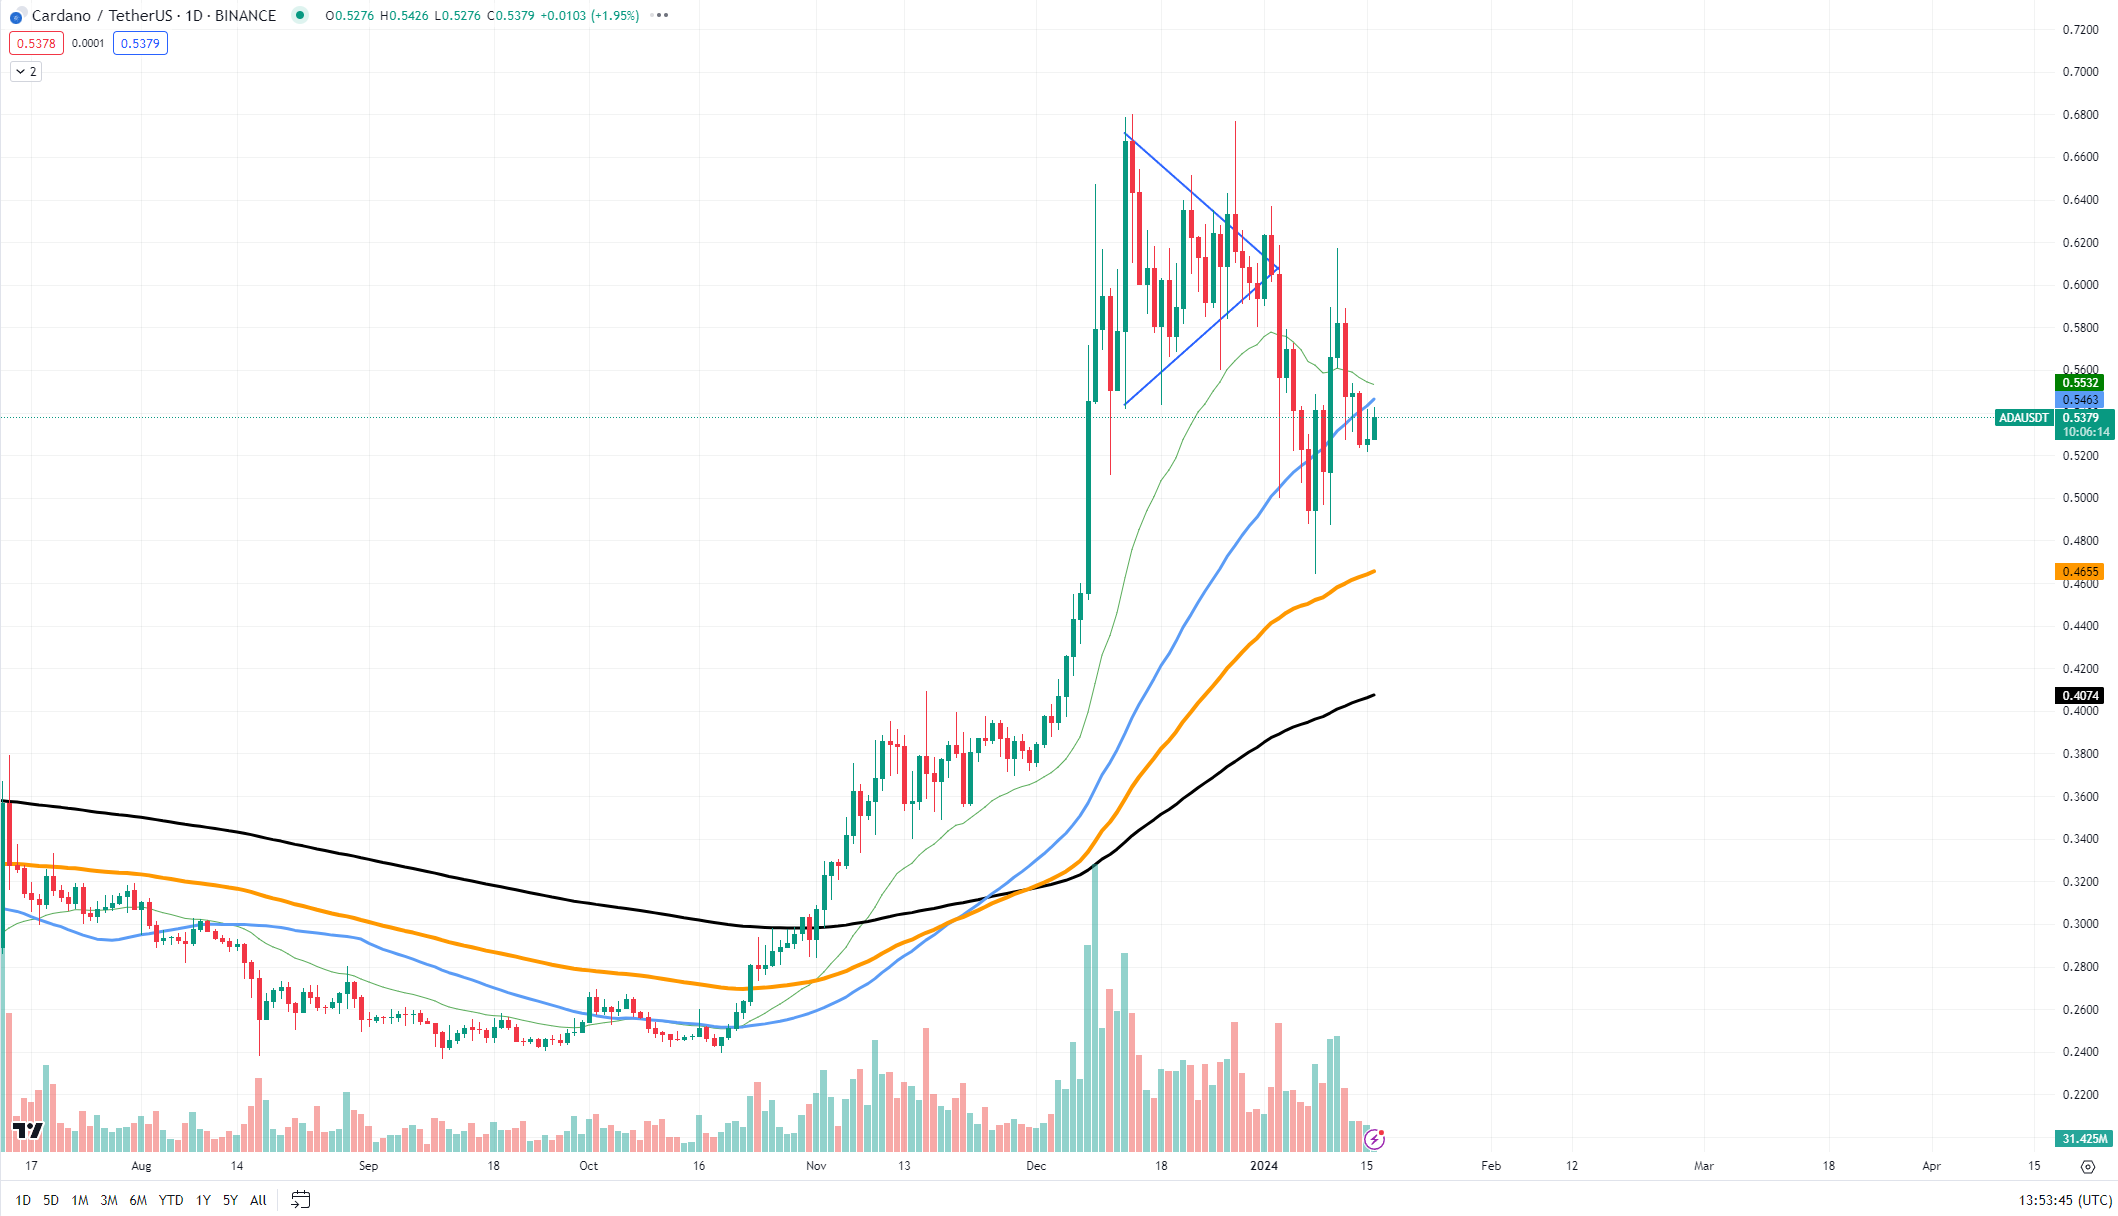
The chart for ADA shows that while it has dipped below the 50 EMA, the price has consistently found support along this concealed trendline. This indicates that despite the bearish crossover, there is strong underlying buying interest preventing the price from falling further. Each time ADA approaches this trendline, the market responds with enough buying pressure to maintain its general uptrend, signifying robust and sustained support from its investor base.
The support levels, derived from this trendline, are crucial for maintaining the current uptrend. A breach below could signal a change in investor sentiment and a potential trend reversal. However, as long as ADA remains above this line, the uptrend is considered intact.
On the resistance side, local peaks provide immediate targets for ADA's potential upward movement. Each of these peaks represents a point where selling pressure previously overcame buying momentum, and surpassing these will be necessary for ADA to continue its climb. The next significant resistance level is observed at the most recent high before the pullback beneath the 50 EMA.
L2 did not go anywhere
Arbitrum is exhibiting signs that could precede a significant rally. Technical analysis of ARB's chart shows it nearing a pivotal moment – the convergence and potential crossing of the 50, 100 and 200-day Exponential Moving Averages.
These EMA crosses are highly regarded within trading circles, often interpreted as strong indicators that can presage a shift in momentum.

The 50-day EMA serves as a short-term sentiment gauge, the 100-day offers a midterm outlook and the 200-day EMA provides insight into the long-term trend. A cross where the shorter-term EMAs move above the longer-term EMA typically indicates bullish sentiment, suggesting that prices could accelerate upward.
The potential cross of these EMAs could be the catalyst for an explosive rally in ARB's price.
Shiba Inu falls out
Shiba Inu (SHIB) has slipped out of a crucial ascending triangle pattern on its trading chart. This development has invalidated a setup that some traders had hoped would signal a continued uptrend for SHIB.
The ascending triangle pattern is traditionally regarded as a bullish signal in technical analysis, representing a period where higher lows are consistently achieved, indicating increasing demand. However, SHIB's price movement has deviated from this path, breaking down from the triangle's lower trendline and closing beneath it.

This break suggests a shift in market sentiment and tempers expectations for an imminent upward breakout. The asset, which had been winding tighter within the converging trendlines, was anticipated by many to be a decisive move. The breakdown from the pattern indicates that the buildup of buying pressure was insufficient to overcome the resistance at the triangle's upper boundary.
It is crucial to note that the falling out of the ascending triangle does not necessarily presage a dramatic price drop. Since the exit from the pattern was not accompanied by a significant breakthrough in volume or price, it implies that SHIB may enter a period of lateral movement, trading sideways rather than making any notable leaps or dives.
 Dan Burgin
 U.Today Editorial Team