Over past few months, ADA has vindicated itself like a stable cryptocurrency when compared to many other coins in the market. So, the team behind cryptocurrency has made real progress with so many plans in play to help the Cardano`s potential.
Cardano (ADA) is a third generation open-source blockchain project that attempts to solve problems which have plagued its predecessors. According to their website, ADA is “developing a smart contract platform which seeks to deliver more advanced features than any protocol previously developed”. Also, it’s the “first blockchain platform to evolve out of a scientific philosophy and a research-first driven approach”.
Cardano’s cryptocurrency is named ADA and can be used to send and receive digital funds. Cardano itself is a tech platform that will be able to run financial applications and decentralized applications (dApps), which are services that operate on the blockchain.
The platform will also be able to run smart contracts and is a rival for Ethereum. Ethereum is dominating the current smart contract picture, but Cardano aims to deliver a more efficient form; it remains to be seen if they can actually deliver on such big promises.
ADA/USD technical outlook – The big picture
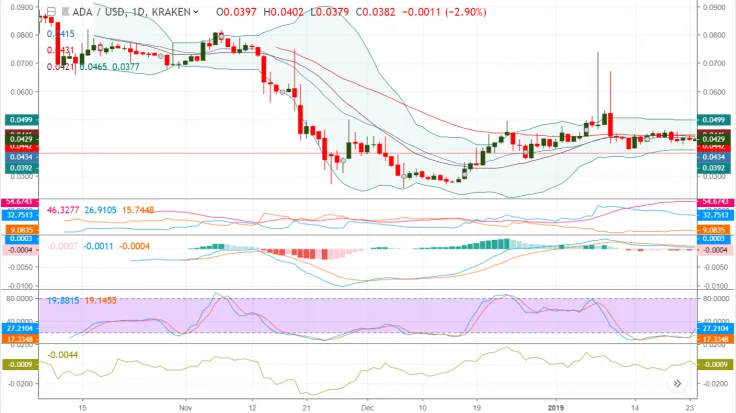
Currently occupying the 11th spot in the market cap rankings, Cardano (ADA) is trading a little above $0.038 at the moment. The entire year of 2018 was bearish and even saw ADA drop below its launch price on some exchanges. It’s all been downhill since the big bull run of 2017/2018, and it looks like there’s not much hope of a recovery – at least not yet.

The price is flat, with low volatility and low volume, which is a far cry from the bounce up seen in April 2018, which took the price into 0.40 area. It almost looks like the bulls have totally abandoned this cryptocurrency but interestingly, the bears have done so as well.
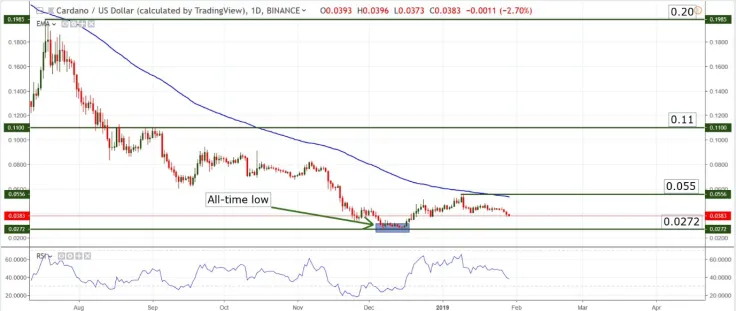
The most important level at the moment is the support at 0.0272 - keep in mind this number will probably be different depending on the exchange you are dealing with. The level is also the all-time low, and a break of it would throw the pair into uncharted territory, meaning that we don’t have any known support below this level.

From a Daily chart perspective (above), we can see that resistance sits at 0.055 and at the 100 days Exponential Moving Average (blue line), followed much higher by 0.10 – 0.11 and 0.20. The chart shows clear lower lows and lower highs, so the pair is in a textbook downtrend and is not oversold.
Given the low volatility and almost flat movement seen on Weekly charts, this pair should be treated as currently ranging/sideways, but from a long-term perspective all clues point towards a continuation of the downtrend, which will be achieved when/if the all-time low is broken.
Daily Chart Support: 0.0272 (the exact price differs depending on exchange)
Weekly Chart Support: 0.0272
Daily Chart Resistance: 0.055 and the 100 days EMA
Weekly Chart Resistance: 0.11 and 0.20
Most likely scenario: continuation of the downtrend, break of all-time low unless the developers announce something extremely positive
Alternate scenario: irregular volatility, range-bound trading, chance for minor upswings if the pair becomes oversold
 Tomiwabold Olajide
 Arman Shirinyan
 Alex Dovbnya
 Denys Serhiichuk
 Gamza Khanzadaev