Disclaimer: The opinions expressed by our writers are their own and do not represent the views of U.Today. The financial and market information provided on U.Today is intended for informational purposes only. U.Today is not liable for any financial losses incurred while trading cryptocurrencies. Conduct your own research by contacting financial experts before making any investment decisions. We believe that all content is accurate as of the date of publication, but certain offers mentioned may no longer be available.
The cryptocurrency market is trying to remain in a bullish trend even though most of the coins have reached their local peaks. Today, XRP is the top gainer, having risen by 6.52% since yesterday.
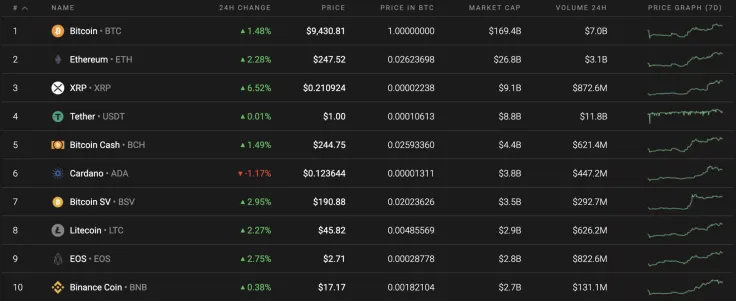
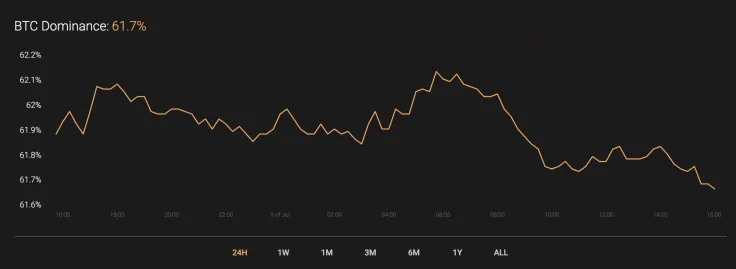
As the rates of altcoins have not changed much over the past day, the dominance rate of Bitcoin (BTC) has remained almost on the same level. Currently, the market share of the leading crypto amounts to 61.7%.
The relevant data of Cardano is as follows.
-
Name: Cardano
Advertisement -
Ticker: ADA
-
Market Cap: $3,204,542,366
-
Price: $0.123598
Advertisement -
Volume (24h): $713,695,970
-
Change (24h): -1.01%
The data is relevant at press time.
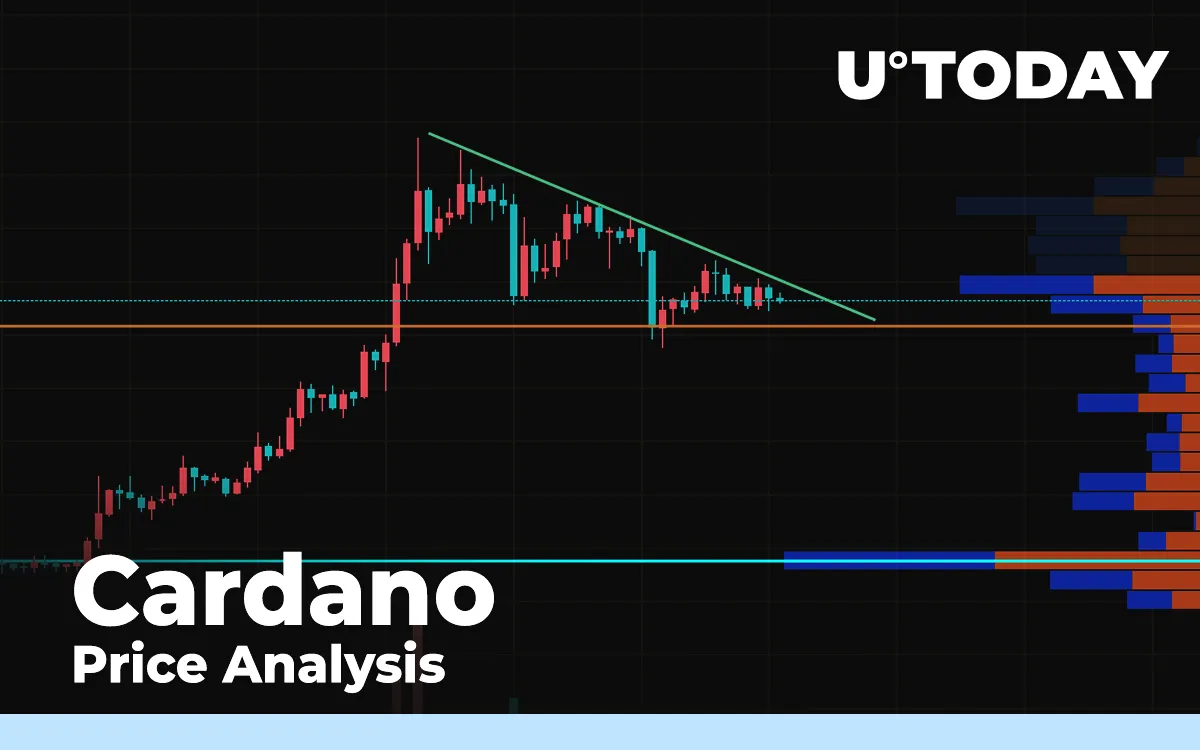
ADA/USD: Will coin continue the recent pump?
Cardano (ADA) has shown the biggest growth of all of the other coins from the top 10 list. The rate of the altcoin has rocketed by 31.65% over the past 7 days.
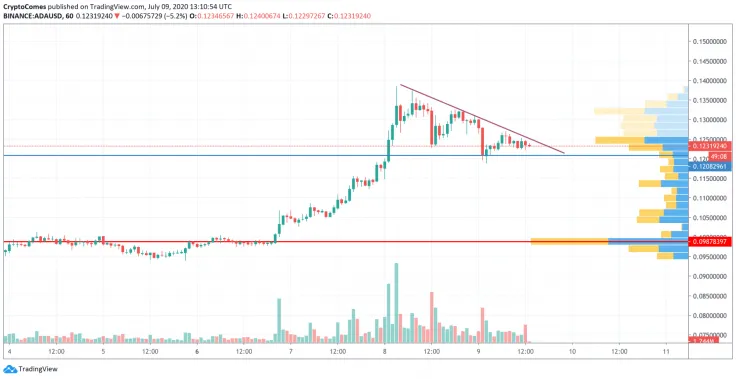
On the hourly time frame, there are lowering heights against the slightly declining trading volume, which is a bearish scenario in terms of price action. Buyers are showing no resistance, while bears are pushing ADA to the support line. This is why the nearest stop is likely at the $0.12808 mark, which may be attained by mid-July.

The 4H time frame is 'showing' the same price action. Trading is decreasing, confirming the absence of bulls. Thus, there is no liquidity at current levels, which is another reason for a decline. Respectively, the drop may occur to the 'mirror' level at $0.1188. It might happen by the end of the week.
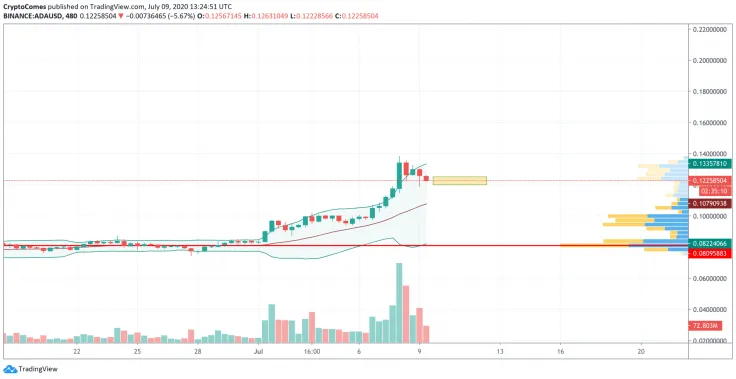
On the bigger chart, the bullish trend has stopped. However, the bearish one has not started yet. If sellers push Cardano (ADA) below $0.12 and hold the price there, the recent growth will not be relevant anymore. But currently, the more likely projection is sideways trading in a range between $0.12 and $0.1250 until mid-July 2020.
Cardano is trading at $0.1226 at press time.
 U.Today Editorial Team
 Dan Burgin