Disclaimer: The opinions expressed by our writers are their own and do not represent the views of U.Today. The financial and market information provided on U.Today is intended for informational purposes only. U.Today is not liable for any financial losses incurred while trading cryptocurrencies. Conduct your own research by contacting financial experts before making any investment decisions. We believe that all content is accurate as of the date of publication, but certain offers mentioned may no longer be available.
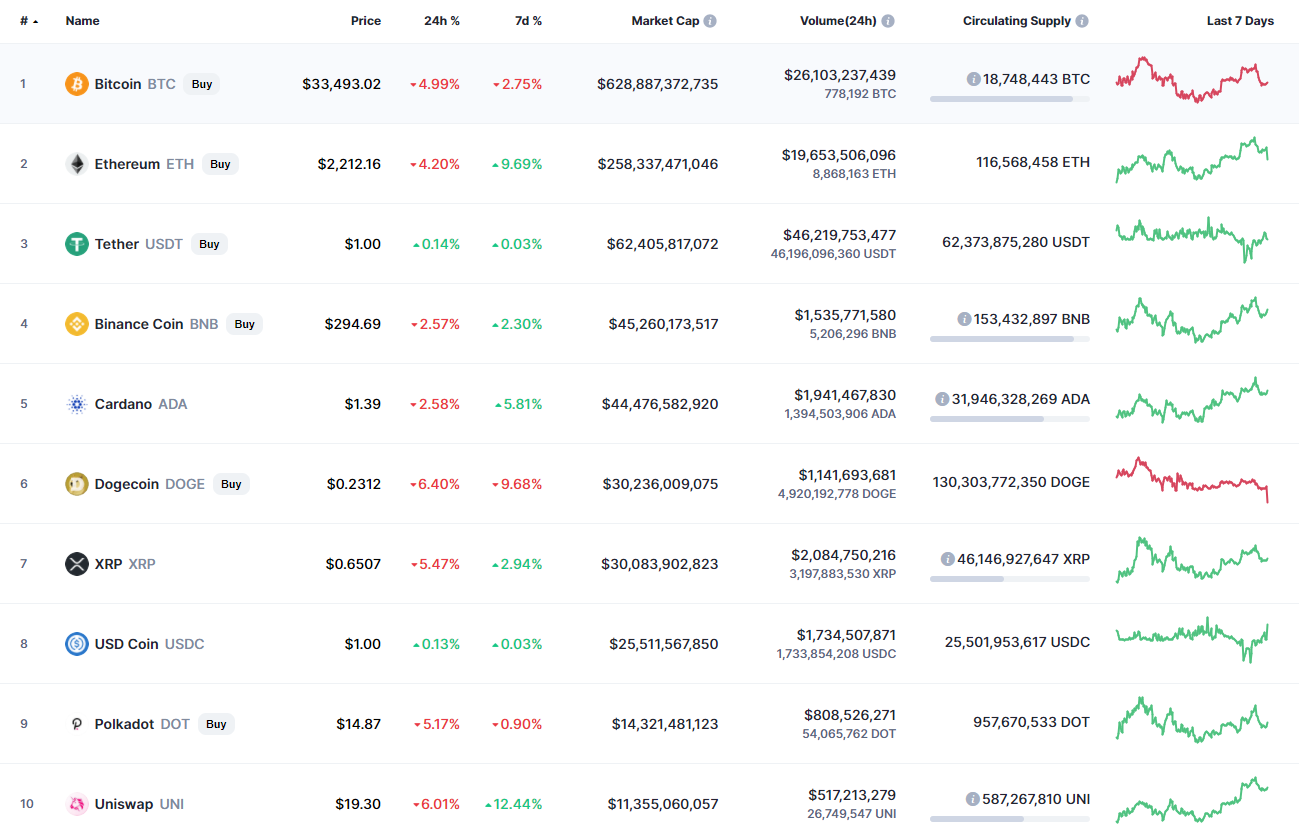
Bulls could not keep the growth started at the weekend and all top 10 coins have come back to the red zone.
BTC/USD
Last Saturday, the Bitcoin (BTC) price recovered within the channel, and on Sunday, buyers tried to test the resistance of $36,000. However, the growth was not supported by large volumes, and the pair could not gain a foothold in the area of $36,000.
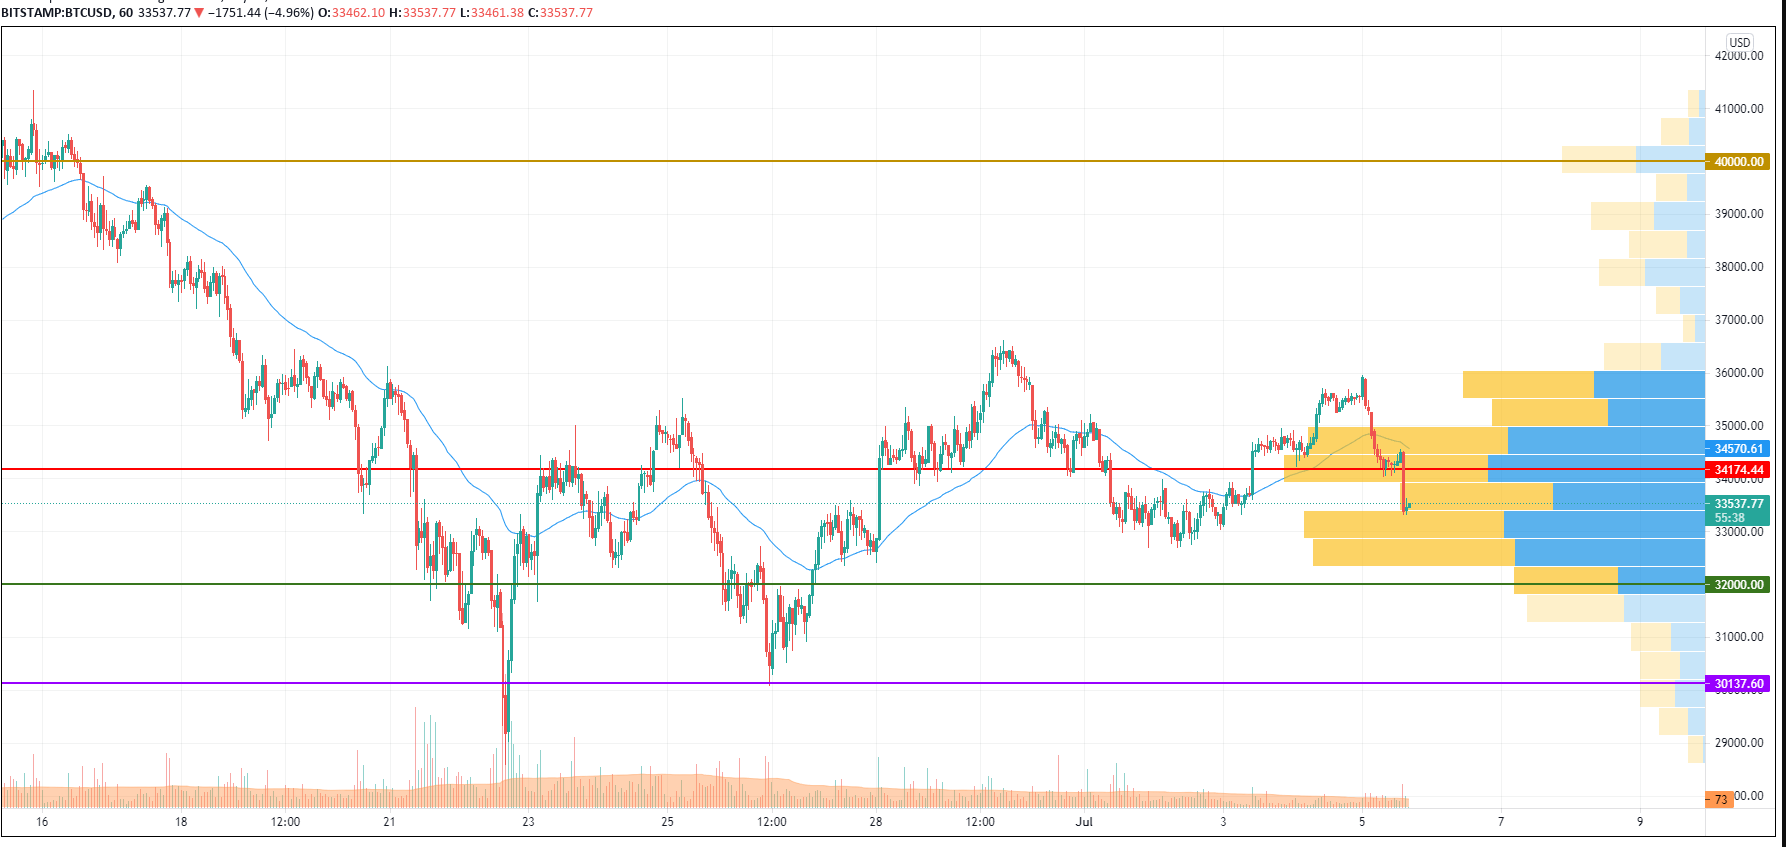
The price returned to the side channel this morning. If the lower border of the corridor ($34,000) does not keep the price in sideways consolidation, then the forecast for the pair to decline to support at $32,500 remains relevant.
Bitcoin is trading at $33,625 at press time.
XRP/USD
Last Saturday, buyers managed to break through the hourly EMA55, and on Sunday they broke above the $0.70 resistance. However, XRP was unable to consolidate above this level.
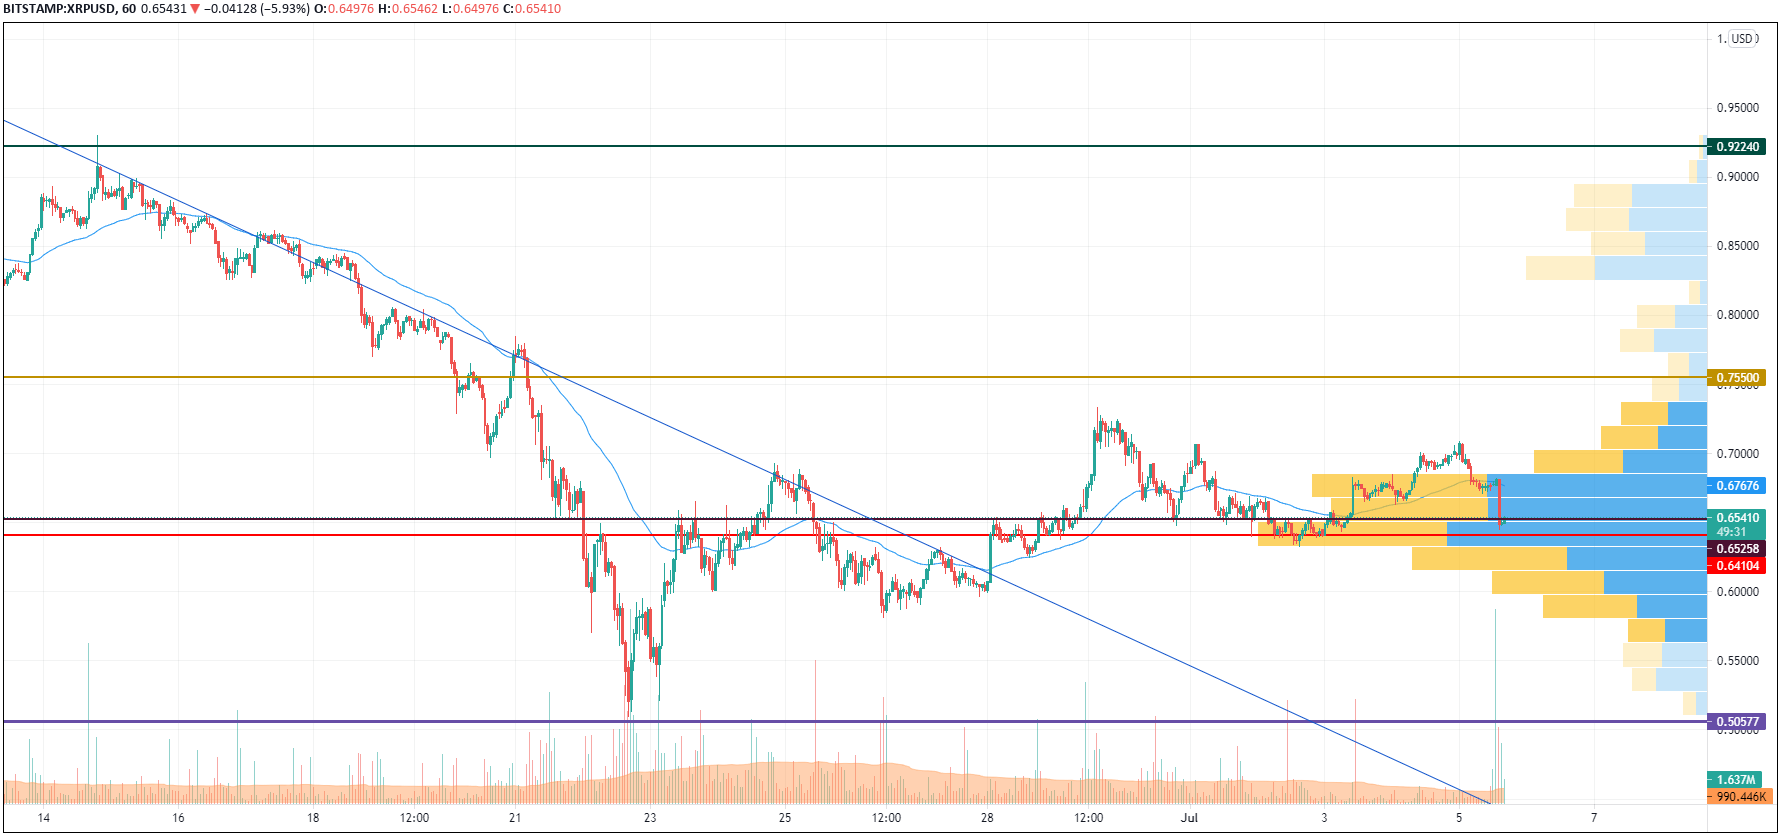
Tonight the pair returned from the maximum zone to the area of average prices and stopped the decline, but if the bears break through the support of the EMA55 moving average, the price can roll back to the POC line ($0.641).
XRP is trading at $0.6545 at press time.
LTC/USD
The rate of Litecoin (LTC) keeps falling, losing 5.53% of its price share over the last day.
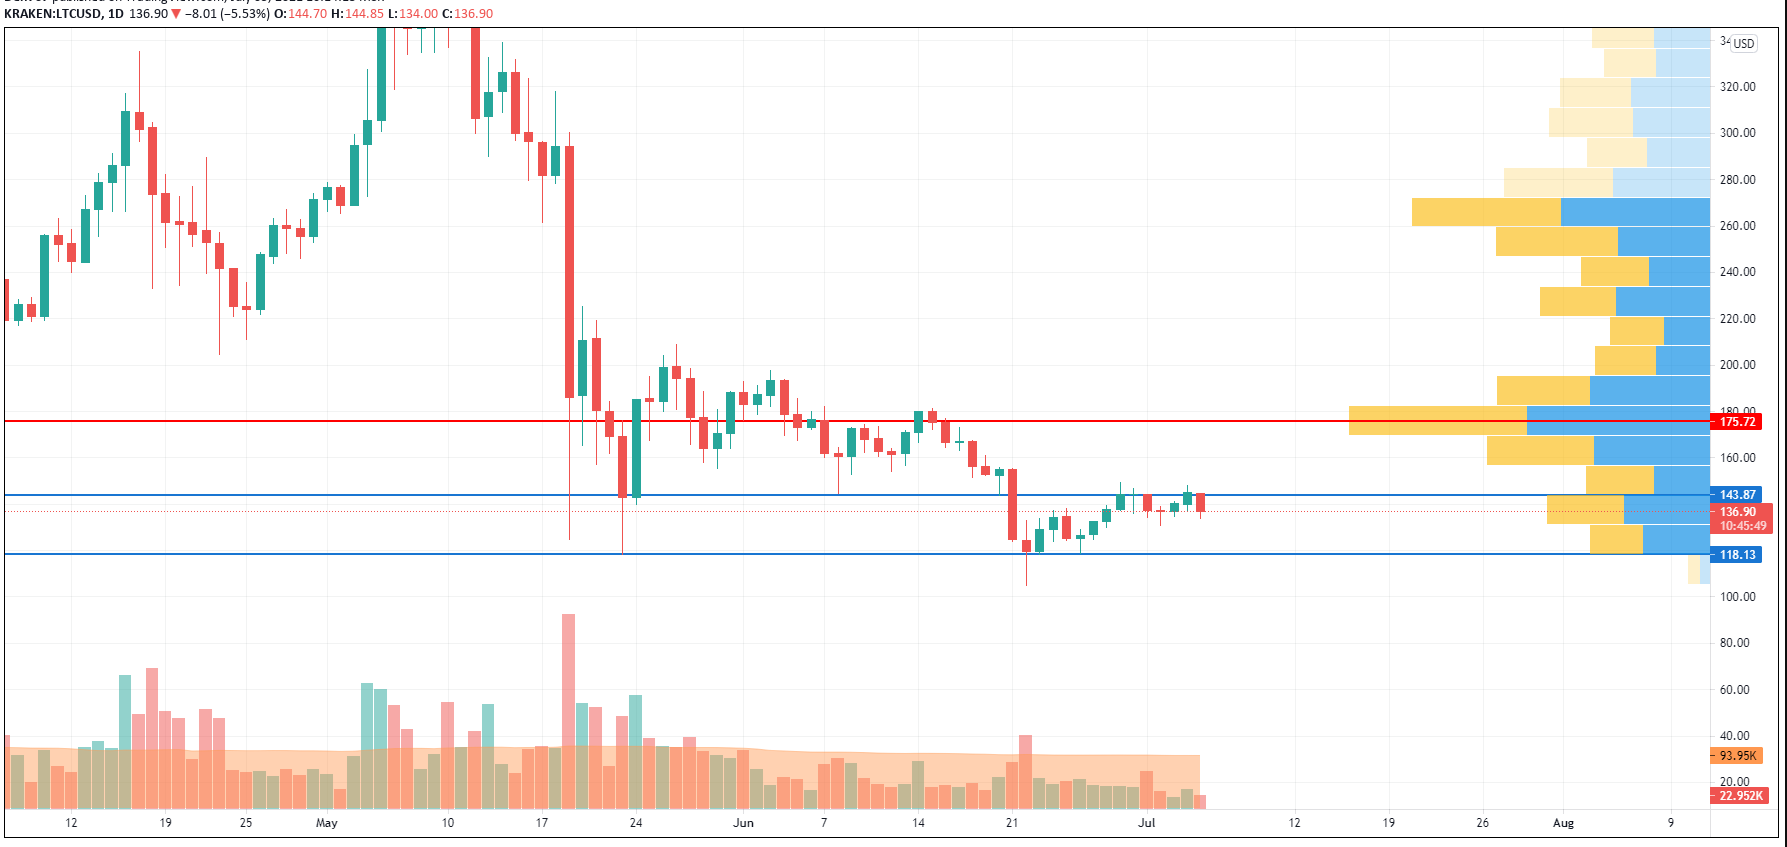
Litecoin (LTC) has made another false breakout of the resistance at $143 which means that bulls are not ready yet to keep the rise. However, the selling trading volume is going down, confirming the weakness of bears.
In this case, the sideways trading between $143 and $130 is the more likely price action for the next few days.
Litecoin is trading at $136.57 at press time.
LINK/USD
Chainlink (LINK) has lost less than Litecoin (LTC) as its rate has decreased by 5%.
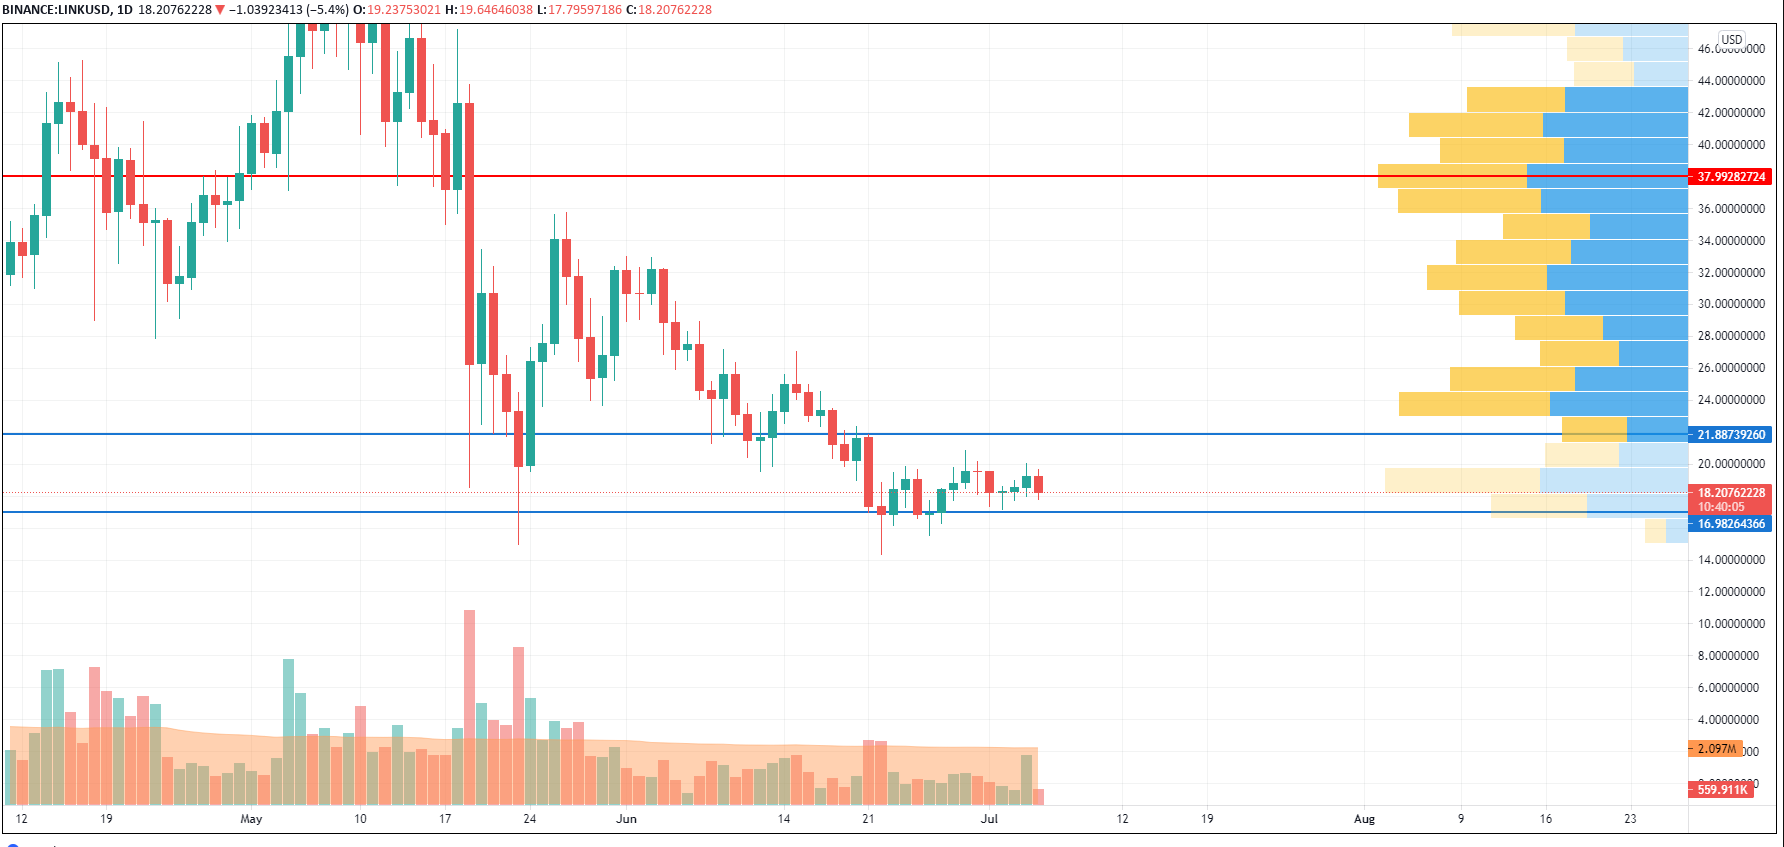
Chainlink (LINK) is trading similarly to Litecoin (LTC) as it is also located in the sideways range. At the moment, the altcoin is closer to the support zone than to the resistance which means that its breakout can lead to a sharp decline to $14.
LINK is trading at $18.19 at press time.
XLM/USD
Stellar (XLM) is the top loser today, going down by almost 6% since yesterday.
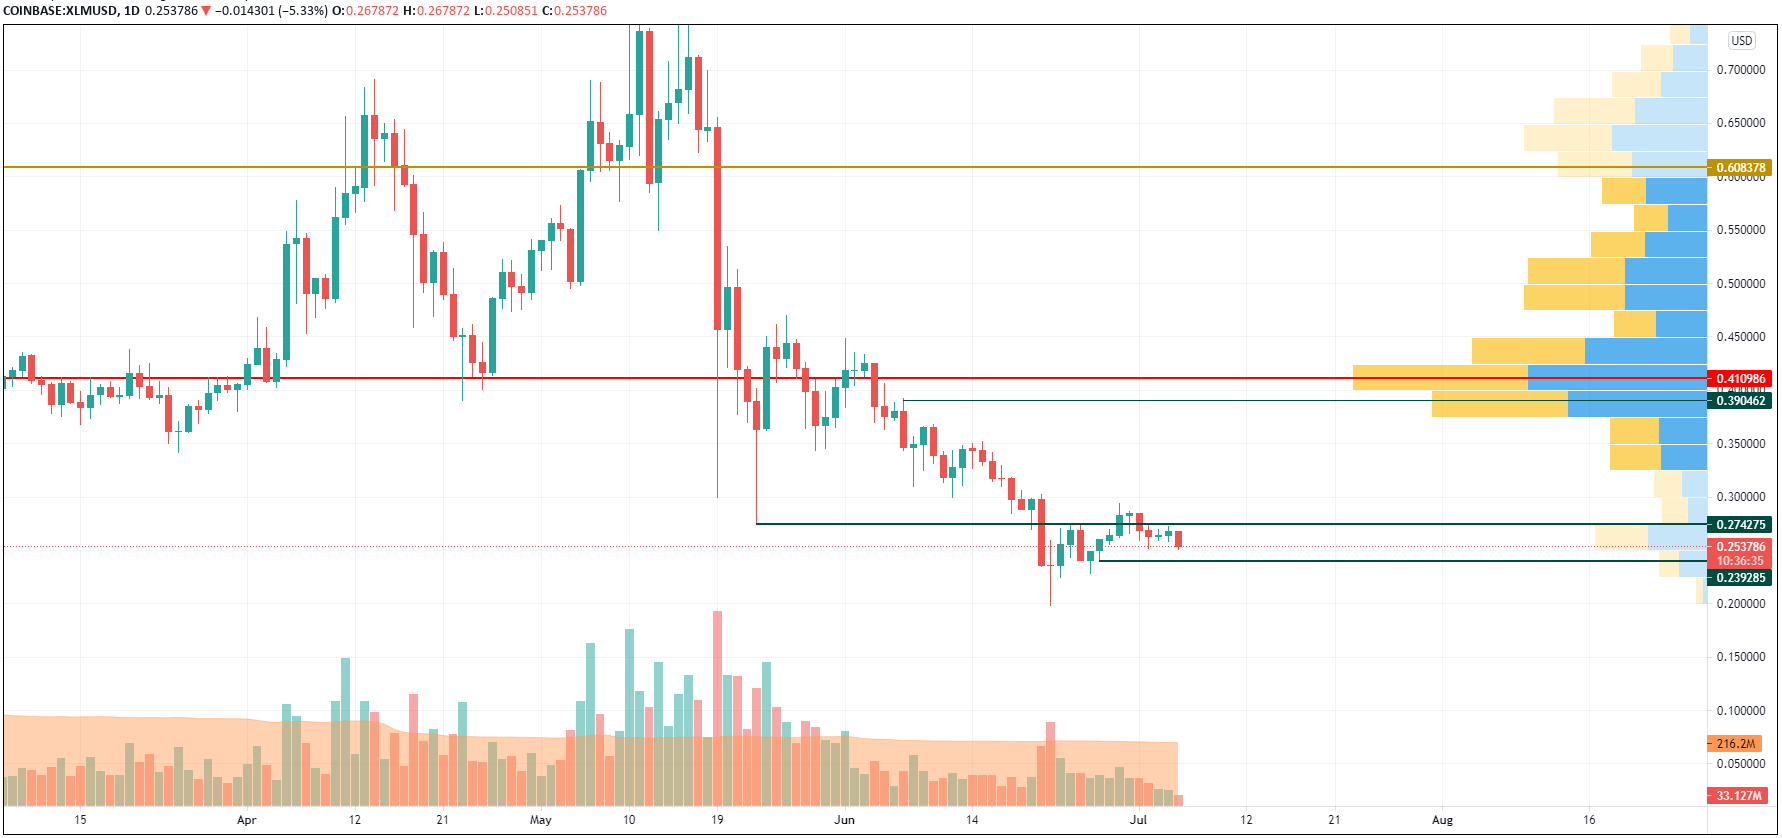
Stellar (XLM) has confirmed the ongoing bearish mood as the coin has fixed below the $0.2742 mark. In this regard, there are chances to continue to drop to the nearest level at $0.2392.
XLM is trading at $0.2536 at press time.
 Alex Dovbnya
 Godfrey Benjamin
 Gamza Khanzadaev