
*** Please note the analysis below is not investment advice. The views and opinions expressed here are solely those of the author and do not necessarily reflect the views of U.Today. Every investment and trading move involves risk, you should conduct your own research when making a decision.
Bitcoin respected our mentioned level
The whole market made a short pump upwards. This was due to the fact that BTC bounced upwards from our mentioned level at $6,250. BTC’s move pulled all the altcoins upwards as well and like we said the whole market got pretty nice bullish momentums.
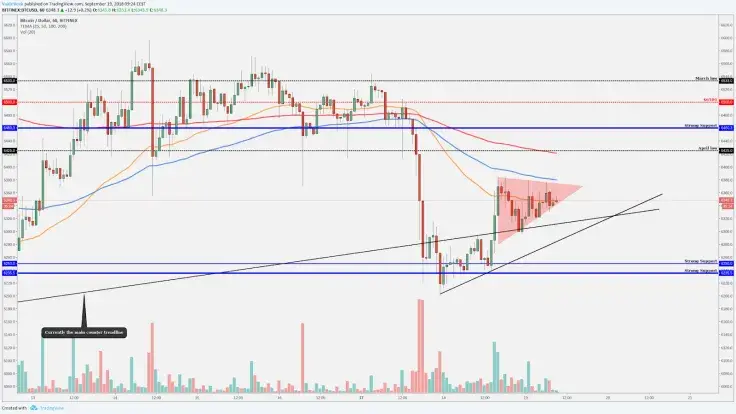
From a technical perspective, Bitcoin now trades above the major counter trendline which is pulled from Sept. 18. The bounce from $6,250 made a scarcely higher low which is good for the price structure and will indicate that we are still in the short-term bullish market.
Currently, we are on the chart pattern, slightly in the bullish "Ascending Triangle.” If we break upwards then we could see another leg up to the important resistance levels. The next and first resistance would be around the April low, in the one-hour chart there is 200 EMA and in the four-hour chart there is 50 EMA.
If we don't find the power to break through from the triangle upper trendline then the first bearish sign will be when we get a candle close below the counter trendline. After that, we might go and retest the strong area at $6,250 but nothing can be confirmed before we see a candle close below the counter trendline.
Ripple (XRP/USD) exploded
Yesterday, when the whole market started to pump upwards, Ripple just exploded. We’ve discovered the bullish chart pattern (Inverted Head & Shoulders) on the XRP/USD chart and it even made five percent in minutes! The detailed post is here: (https://www.tradingview.com/chart/XRPUSD/aWWYaTLf-RIPPLE-XRP-USD-Inverted-Head-and-Shoulders/)
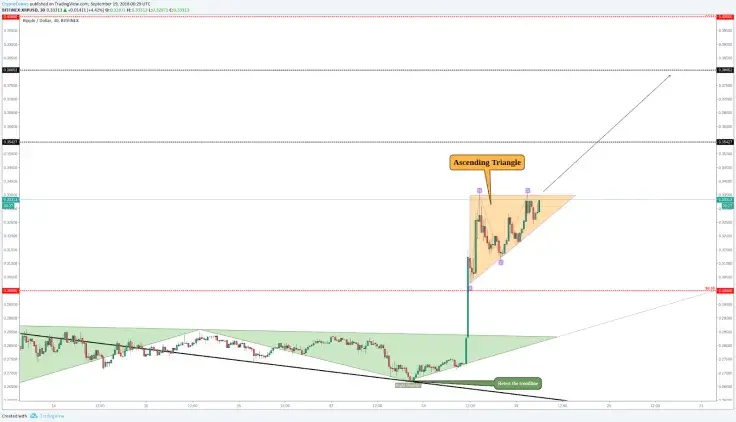
Currently, it has made a little bit over 18 percent growth since we discover this momentum and now we could see another move upwards if we can break above the bullish "Ascending Triangle" upper trendline/support. Our main target is the round number $0.4 but we could see stops around $0.35 and around $0.38. This move upwards should also be supported by Bitcoin, BTC has to at least hold the current price and can't break below the counter trendline, if it manages to hold this then Ripple definitely starts to climb higher.
Bitcoin Cash (BCH/USD) “Double Bottom”
After the pump on the market, BCH shows us bullish momentum, it was supported by the “Double bottom” chart pattern.
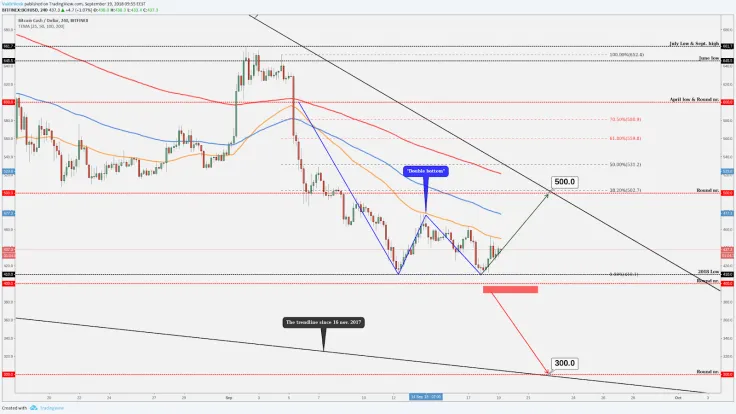
The 2018 low support level is around the $400 level and as you can see on the chart we made a bounce upwards from there and this bounce creates a "Double bottom" chart pattern which indicates that we may see a move upwards but again it is all based on what BTC does! If it finds the short-term momentum to break above the triangle then we have a nice platform on the BCH chart as well.
The target would be the next round number of $500, criteria:
1. The major trendline, which is pulled from the wicks on the four-hour chart since Jan. 11, 2018
2. The round number of $500 starts to work as a resistance
3. Fibonacci retracement 38 percent
4. Fibonacci extensions from the current waves are between 141 percent and 162 percent
If BTC starts to show a weakness then we could see that BCH follow this move and the bearish confirmation would be a candle close below the $400 level. A candle close below the 2018 low level and below the round number will guide us to the drop and the main target would be $300.
Technically a good place for the price reversal (at least short-term):
1. The minor trendline since Nov. 16, 2017
2. The round number of $300 starts to work as a support
3. Fibonacci extension 141 percent pulled from July 24 to Aug. 14.
Both, the upward target and the downward target, are in the crossing area. If some price action criteria match each other then it will make this area much stronger.
 U.Today Editorial Team
 Dan Burgin