
Disclaimer: The opinions expressed by our writers are their own and do not represent the views of U.Today. The financial and market information provided on U.Today is intended for informational purposes only. U.Today is not liable for any financial losses incurred while trading cryptocurrencies. Conduct your own research by contacting financial experts before making any investment decisions. We believe that all content is accurate as of the date of publication, but certain offers mentioned may no longer be available.
Few people realize what is going on in the cryptocurrency market these days, and that statement has generally always been true. However, it is also true that the market and its participants have not seen such turmoil in a long time.
On the one hand, they say "buy the drawdown"; on the other hand, they say that we are already in a bear market, and it is necessary to abandon ship before it sinks completely.

Let's not be too proactive and try to predict what and how, but simply react. Statistical tools and indicators like the Bollinger Bands can help. Developed by John Bollinger, a trader who has become a legend on the financial markets, the indicator is a 23-day moving average and two deviations from it - up and down.
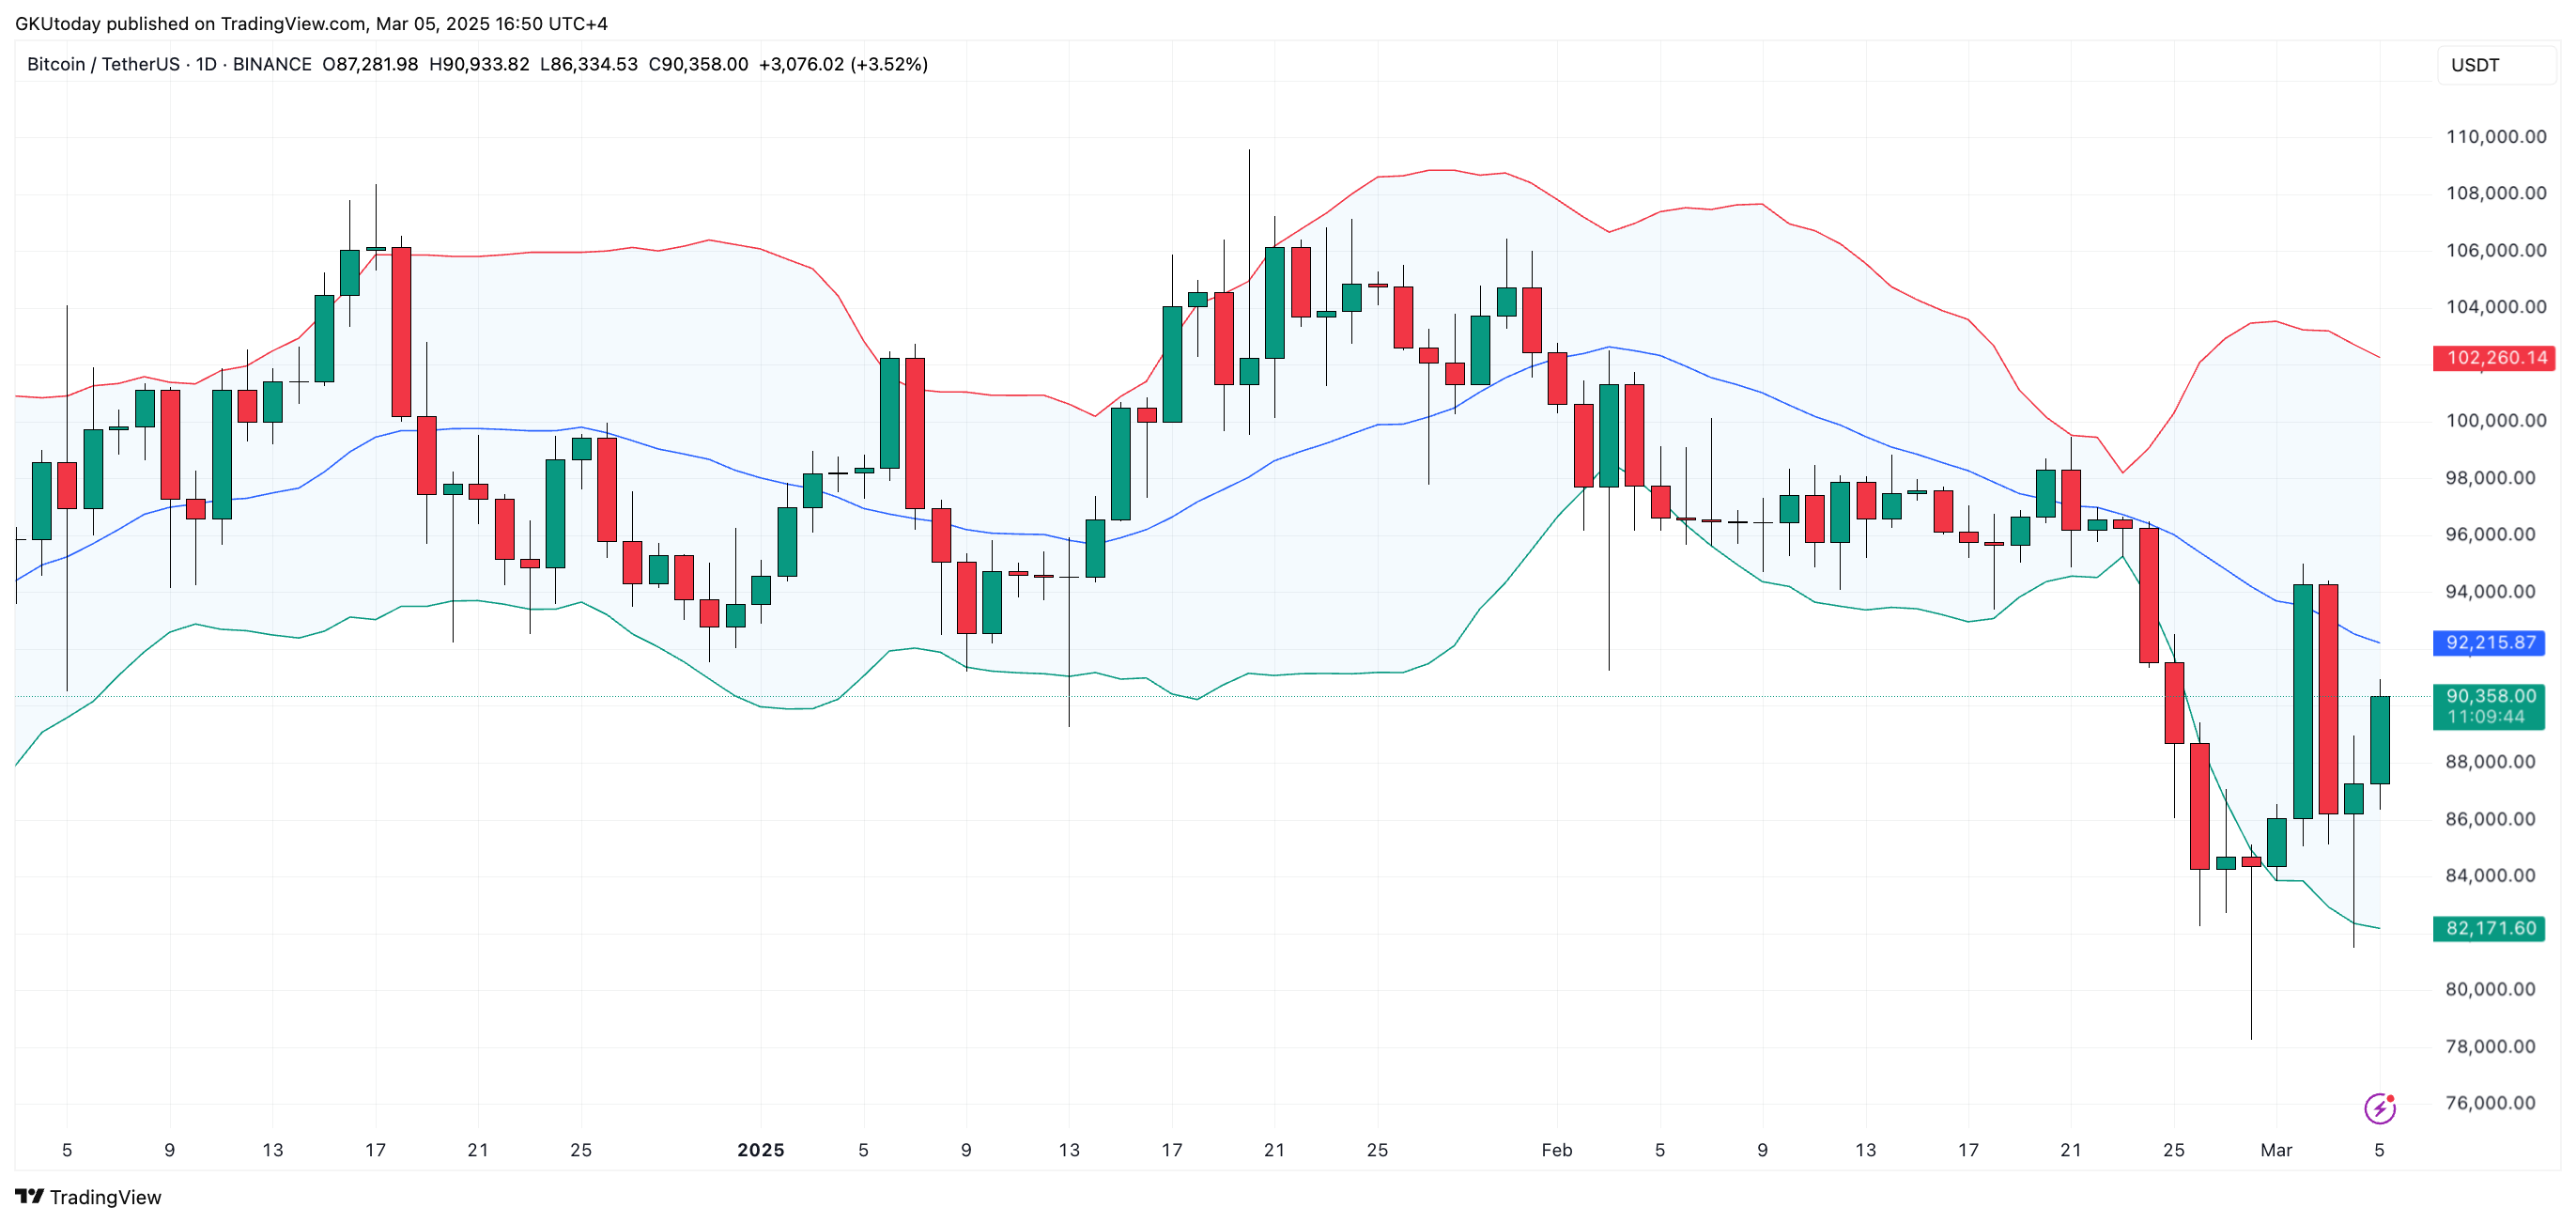
Looking at the indicator on the daily time frame, which makes it more solid, we can see that since the end of January, when the price of Bitcoin fell below the middle band, the main cryptocurrency has never come back above it.

However, after the volatility of the past few days, the price of BTC has touched the lower band at $81,500 and has been rising from there. However, despite testing the lower boundary of this range, the middle curve has still not been touched and is currently stretched at $92,200.
Given the trends of the past few weeks, when even the announcement of Bitcoin's inclusion in the U.S. Strategic Reserve failed to help the cryptocurrency move beyond this curve, it is safe to assume that BTC, currently trading at $90,700, will find its stop at this level.
 Dan Burgin
 U.Today Editorial Team